Multi-Asset Insights
In a nutshell
- Recent EM strength reflects more than a weaker US dollar; stronger fundamentals, improved external balances and credible inflation frameworks have reduced vulnerability to global risk off shocks
- Structural themes around AI, data centre build out and digital infrastructure are increasingly central to the EM story, with North Asia and China at the core of the AI supply chain and India and parts of the Middle East emerging as key data and AI hubs
- Metals sit at the heart of the EM story, as precious and industrial metals benefit from tight supply and long term demand from urbanisation, electrification, energy transition and AI infrastructure, creating opportunities across EM FX, equities and fixed income
- EM remains highly heterogeneous: commodity exporters, AI beneficiaries and oil import dependent Asia face very different risk profiles, reinforcing the need for selective, active allocations
Emerging markets: Beyond dollar luck
EM is no longer a single ‘risk‑on’ trade – it’s a heterogeneous opportunity set demanding selective consideration.
In 2025, the stars aligned for emerging markets and the asset class delivered stellar returns. Much of the credit for this performance has been given to a weaker US dollar but there is a great deal more happening under the hood. The EM story has evolved, with macro, valuation and thematic tailwinds of AI and commodities all now providing structural support for EM assets. Even with stronger structural tailwinds, performance is uneven across EM, making active, selective positioning critical.
EM performance is about fundamentals, not just luck
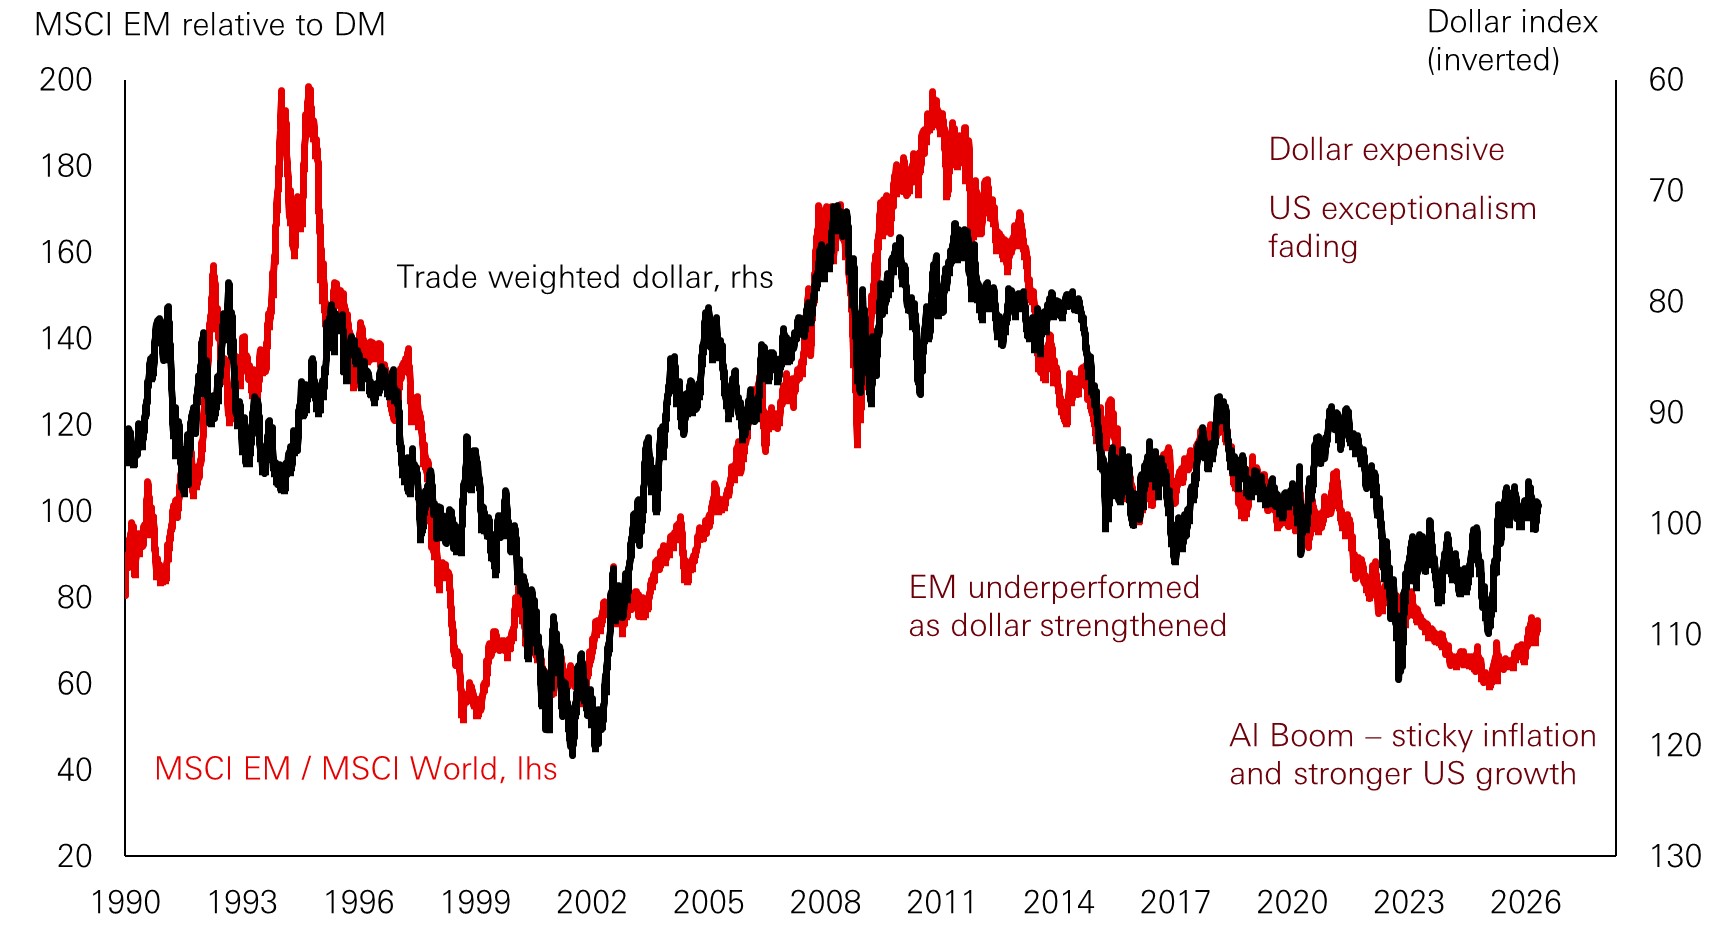
The performance of EM assets has long been intertwined with movements in the dollar. EM economies often issue debt in USD, so a weaker dollar makes servicing this debt in local currency cheaper. It also improves the competitiveness of EM exports, especially in commodities, which are key exports for many EM economies .
In 2025 and the start of 2026, the US dollar weakened as confidence in US economic policy and Federal Reserve independence eroded. As one would expect against this backdrop, the performance of EM assets was strong.
Figure 1: Weaker dollar (black) correlates with strong EM stocks (red)
Click the image to enlarge
Source: Refinitiv, MSCI, HSBC Asset Management, February 2026.
The weaker US dollar was clearly a meaningful tailwind for emerging market performance, but it’s far from the only driver. EM economies have become more fundamentally sound, delivering trend GDP growth that has generally exceeded that of developed markets since the financial crisis, strengthening fiscal management and FX reserves, and enhancing central bank credibility. The latter is closely linked to the inflation backdrop in EM economies.
EM central banks were generally quicker than their DM counterparts to hike interest rates after the Covid pandemic, and many EM economies were able to get inflation back under control quicker than DM peers. Today, the inflation picture is broadly positive for most EM countries, with issues in China centred on a lack of inflation, in contrast to DM peers. There is still ample room for EM policy rates to fall: Latin American countries such as Brazil, Colombia and Mexico remain near the top of their five‑year ranges, as do many CEEMEA economies, whereas Asian rates tend to sit towards the lower end.
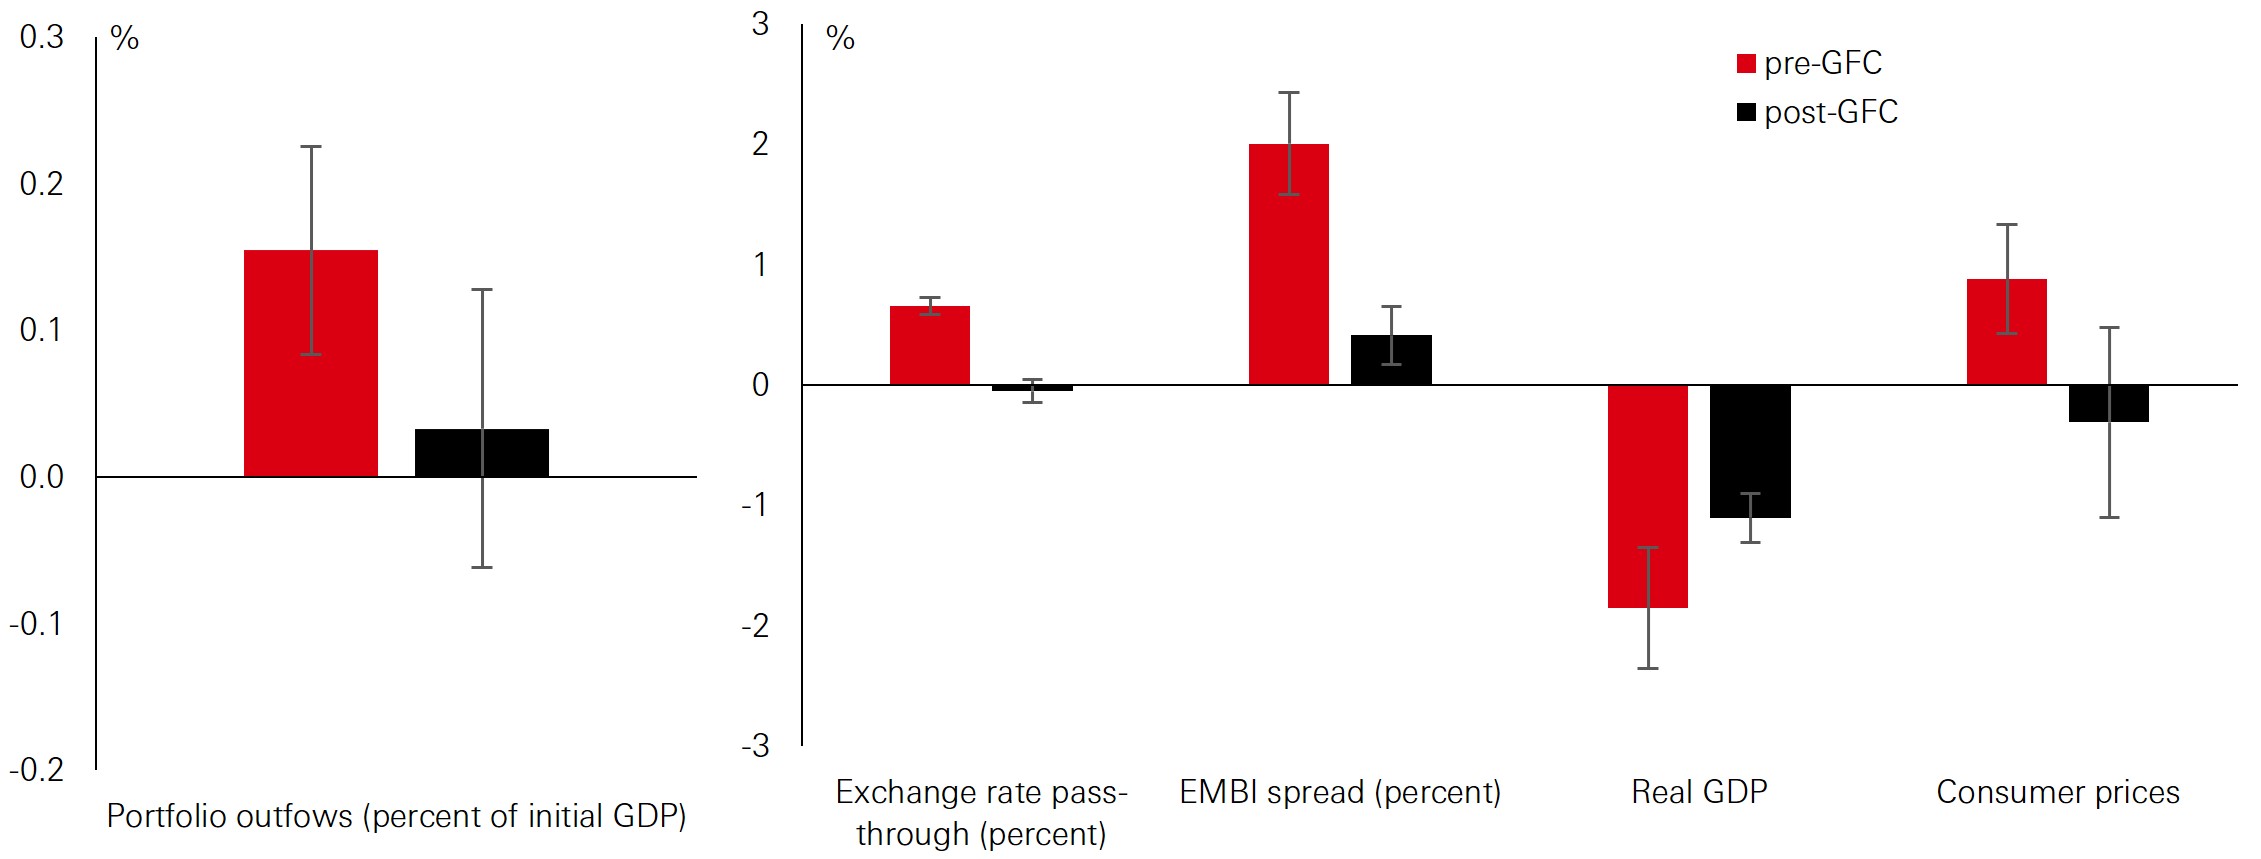
Improving fiscal positions have also reduced vulnerability to external shocks. EMs have lowered external debt to GDP ratios and reduced reliance on US dollar borrowing, diminishing the sensitivity of local bond yields to dollar strength and global risk off episodes. Current account positions have meanwhile shifted from widespread deficits in 2009–2010 towards narrower gaps or surpluses in several economies, including China and South Korea.
Figure 2: EM response to global risk-off shocks
Click the image to enlarge
Source: IMF, HSBC Asset Management, October 2025.
EM at the heart of the AI boom
While EM countries have built resilience against further shocks, when looking at growth, there are two major themes that have dominated over the last year. These are artificial intelligence and commodities. That said, the benefits won’t accrue evenly across emerging markets and capturing them will depend on investing in the right countries, sectors and asset classes.
EM tech companies are at the centre of the global proliferation of AI and, similar to their US peers, they dominate their respective equity markets. In fact, the EM equity universe is more exposed to tech companies than the US, while stock concentration in major AI players is also greater.
Among these concentrated exposures are Taiwanese and Korean chipmakers. These companies are wholly integrated into the global AI supply chain and well placed to benefit from the surge in US hyperscaler capex. We also find EM AI hyperscalers, large companies at the heart of the AI trend that are building out AI networks, compute capabilities and storage at scale. China dominates the hyperscaler market in EM, but it is also focusing its efforts on AI independence versus the west, potentially offering some diversification in the space.
India is also an emerging AI player. Its large IT services sector highlights key vulnerabilities in India’s economy, with AI threatening to replace many of its business. However, the government is trying to pivot towards developing India as an AI hub by incentivising investment from US hyperscalers and hosting global summits. If India successfully rotates towards an AI‑hub model, we could see a growth rotation from white collar vulnerability to a hyperscaler capex beneficiary.
Building EM’s data centre backbone
One key opportunity for India’s AI transition, and EM more broadly, is in data centres. The data centre landscape in EM is relatively nascent – outside China, where it is more established – but things are changing. There is growing demand from US and Chinese hyperscalers to build data centres closer to large populations to reduce latency for end users, and governments such as India’s are offering incentives to attract this investment and boost growth.
China’s position in the data centre market is strengthened by its streamlined permitting system, which allows data centres to be built much faster than in the US and Europe. US export restrictions on high performance chips, which are vital for training AI models domestically, are an obstacle for Chinese hyperscalers but data centres in Southeast Asia provide a means for China to access these chips.
More broadly, ever increasing geopolitical tensions have seen many EM countries reevaluate their reliance on US tech, with China, India, and countries in the Middle East focusing on greater ownership of data and building out their own domestic infrastructure.
The biggest hurdle facing countries building out data centres is utility capacity. Outside China, power supply constraints have led governments such as Malaysia’s to impose limits on new data centre projects to safeguard grid stability around key urban areas. Over time, resolving these constraints could provide a meaningful growth impulse and create AI‑related tailwinds for local fixed income and FX markets.
AI adoption across EM
The adoption and monetisation of AI could offer further opportunities, but progress has been quite uneven across countries and sectors. Strong top-down policy support has enabled rapid AI adoption in the Middle East, while the lack of cloud infrastructure and homogeneous enterprise platforms present an obstacle in other EM regions. However, there are several uniquely EM solutions that could be adopted. For the consumer sector, EM countries – particularly China – have a strong history of building ‘super apps’ that blend multiple functionalities. These apps can combine personal and commercial data that could create new opportunities not seen in DM.
Health care and robotics both represent further opportunities. China’s health care infrastructure and data are relatively centralised and ripe for extensive AI deployment. The country, alongside Korea, is also an adopter of AI robotics to assist in blue collar work. However, many companies engaged in these activities remain privately owned, and while publicly listed opportunities exist, they remain limited compared to the size of the industry.
The EM AI investment landscape
From an asset allocation perspective, Korea and Taiwan are already recognised as deeply entrenched AI beneficiaries, but moves so far this year have highlighted how volatile these concentrated AI plays can be. China, meanwhile, spans multiple AI sub-themes and its pursuit of AI independence offers some diversification versus its narrower North Asian peers, though it would not be completely immune to downturn in US AI stocks.
Outside North Asia, AI is primarily a stock selection story, with limited near term feedthrough to country-level equity and bond indices. Over time, more opportunities are likely, but they depend on a favourable sequencing of AI employment disruption, global AI capex, domestic infrastructure build out, regulation, AI driven productivity improvements and macro conditions.
Metals at the core of EM
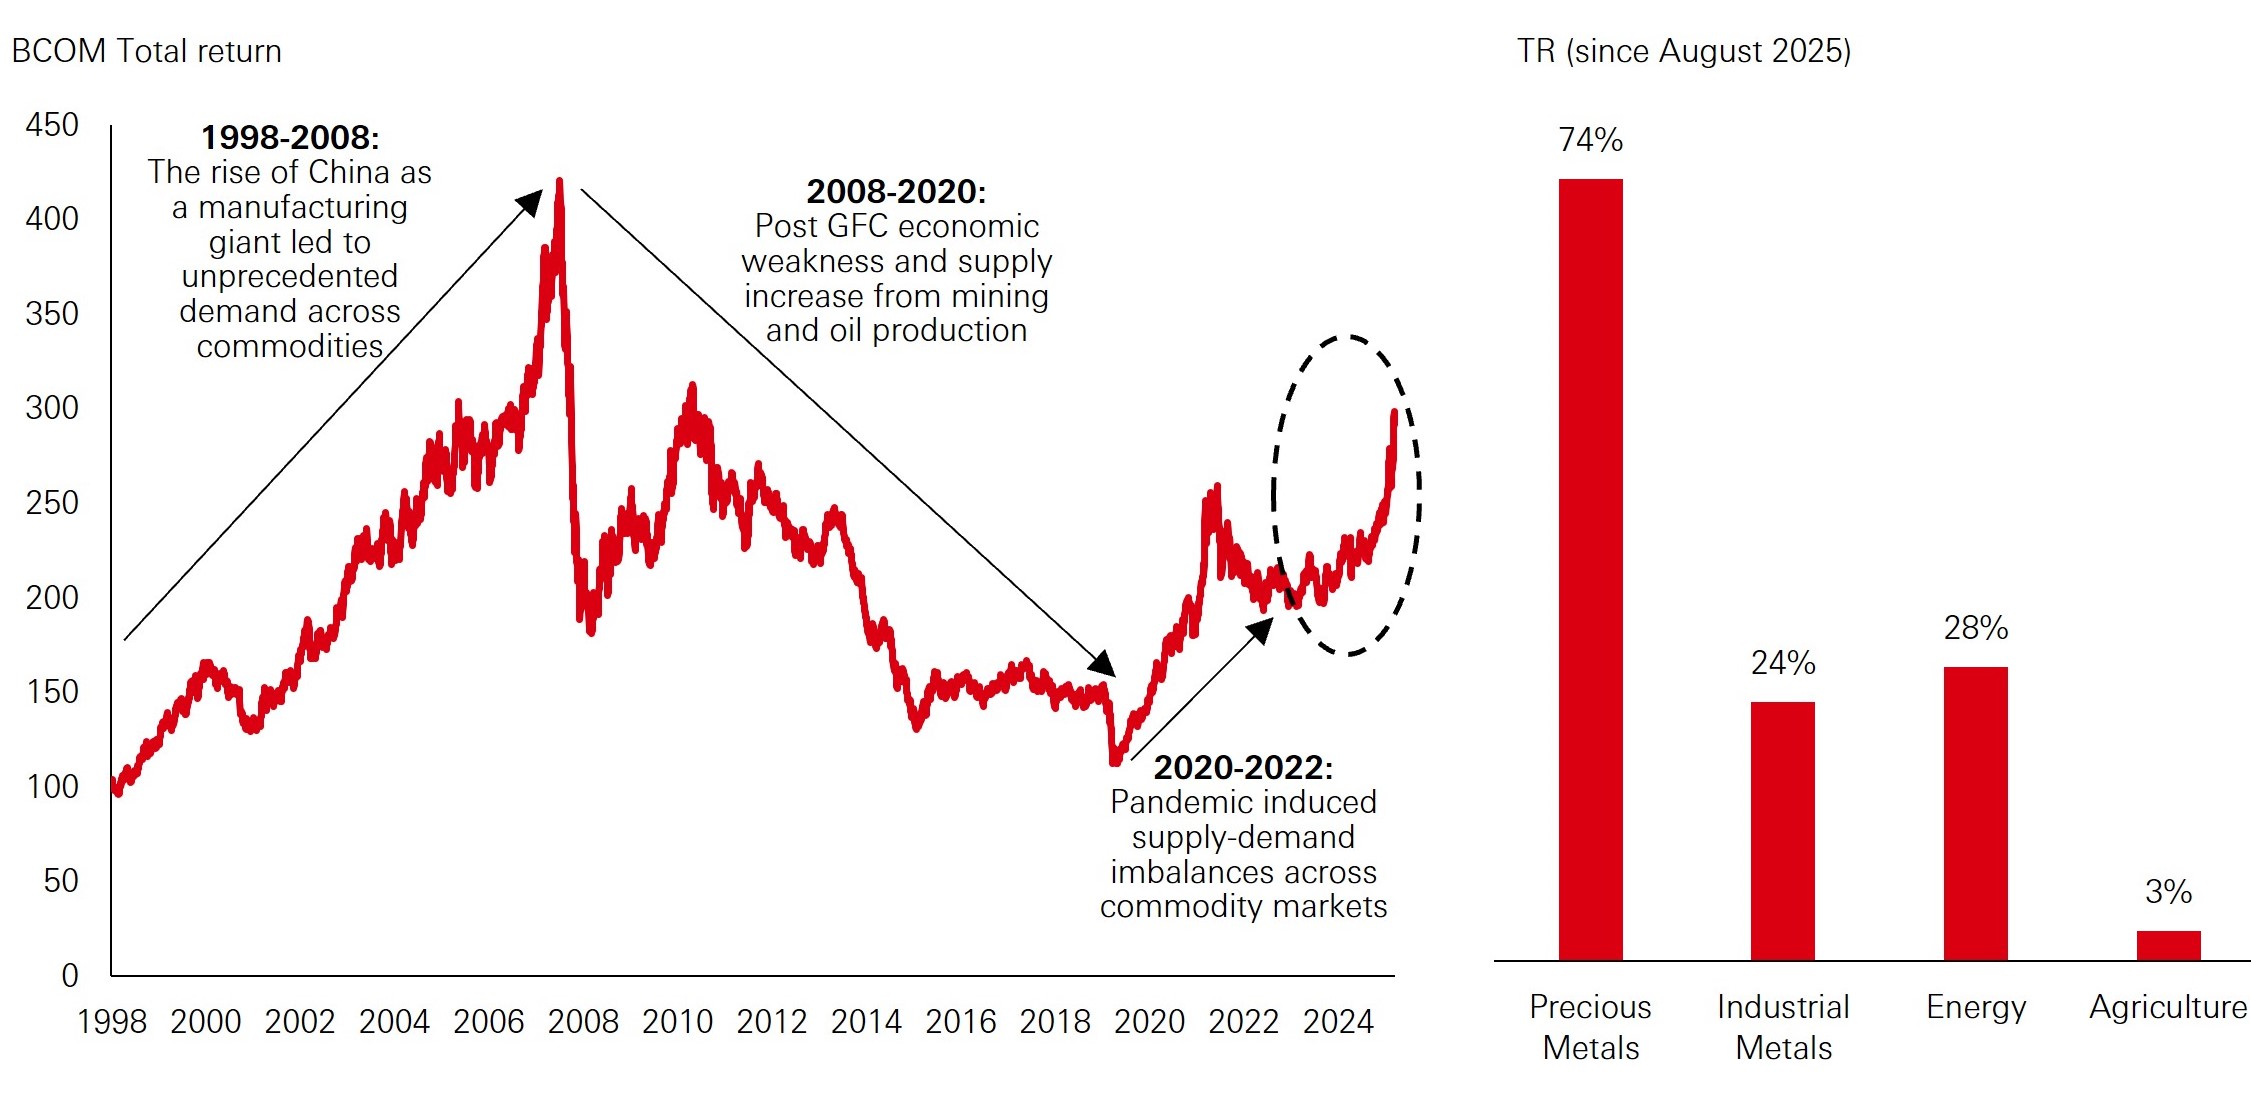
Commodities are among the key exports for EM countries and are central to the investment case. The latest rally in commodity prices has been largely focused on metals, with both precious and industrial metals outperforming since last year, while agriculture and energy have been broadly flat outside the recent Middle East conflict.
Figure 3: EM response to global risk-off shocks
Click the image to enlarge
Source: HSBC Asset Management, Bloomberg, March 2025.
The uptick in metal prices is not just due to the weaker dollar; there is evidence of a structural shift. We recently wrote about how gold is becoming a strategic asset rather than a purely tactical inflation hedge, with central banks now a key component of demand. Additionally, gold has a niche application in AI accelerator chips, which is a small but growing part of its demand.
Demand for industrial metals is also underpinned by long‑term structural themes such as urbanisation, electrification, energy storage systems, and AI and data centre build‑out. Rising geopolitical tensions and de‑globalisation have also ushered in an era of ‘resource nationalism’, with governments building up stocks of critical metals that are seen as essential to national security and industrial policy.
Supply scarcity is another important factor supporting higher prices. Much of the value of precious metals is derived from their scarcity, and the marked slowdown in discoveries of large‑scale gold reserves, as well as the depletion of easily accessible gold deposits, is likely to maintain tight supply.
Industrial metals are also witnessing supply tightness. Years of underinvestment, declining copper ore grades and much longer mine development timelines are limiting the ability of new supply to respond quickly to higher prices. Higher prices can help incentivise secondary scrap supply, but this potentially tightens the market further down the line. As a result, we have entered a new environment where higher prices no longer narrow the supply-demand gap.
Other factors are more policy led such as China’s anti-involution campaign, which has led to cancellations of lithium mining permits and a production cap for aluminium.
Several metals are now already in deficit territory, with balances still tightening. Many EM producers are positively exposed to this supply-demand imbalance. In Latin America, Chile is the world’s largest copper producer while Brazil has exposure to bauxite, which is used in aluminium production. Africa is a large producer of precious metals, while in Asia, China leads in rare earth metals and Indonesia in nickel production.
Accessing the metals story
Commodity-linked derivatives are often the first route that comes to mind when trying to gain exposure to commodities. But for many resources, this avenue isn’t always optimal. For example, there are currently no futures for rare earth metals, lithium is not in the Bloomberg Commodity Index, and even where futures exist (such as copper), they are not always the most liquid.
Equity metal‑linked exposure is therefore a potentially more efficient way for investors to access this theme. The EM metals and mining sector accounts for a larger share of the broader EM index than the equivalent DM sector. At the country level, South Africa stands out, with around 22 per cent of its equity index revenues coming from precious metals, while Poland, Greece and Mexico have the strongest listed links to copper.
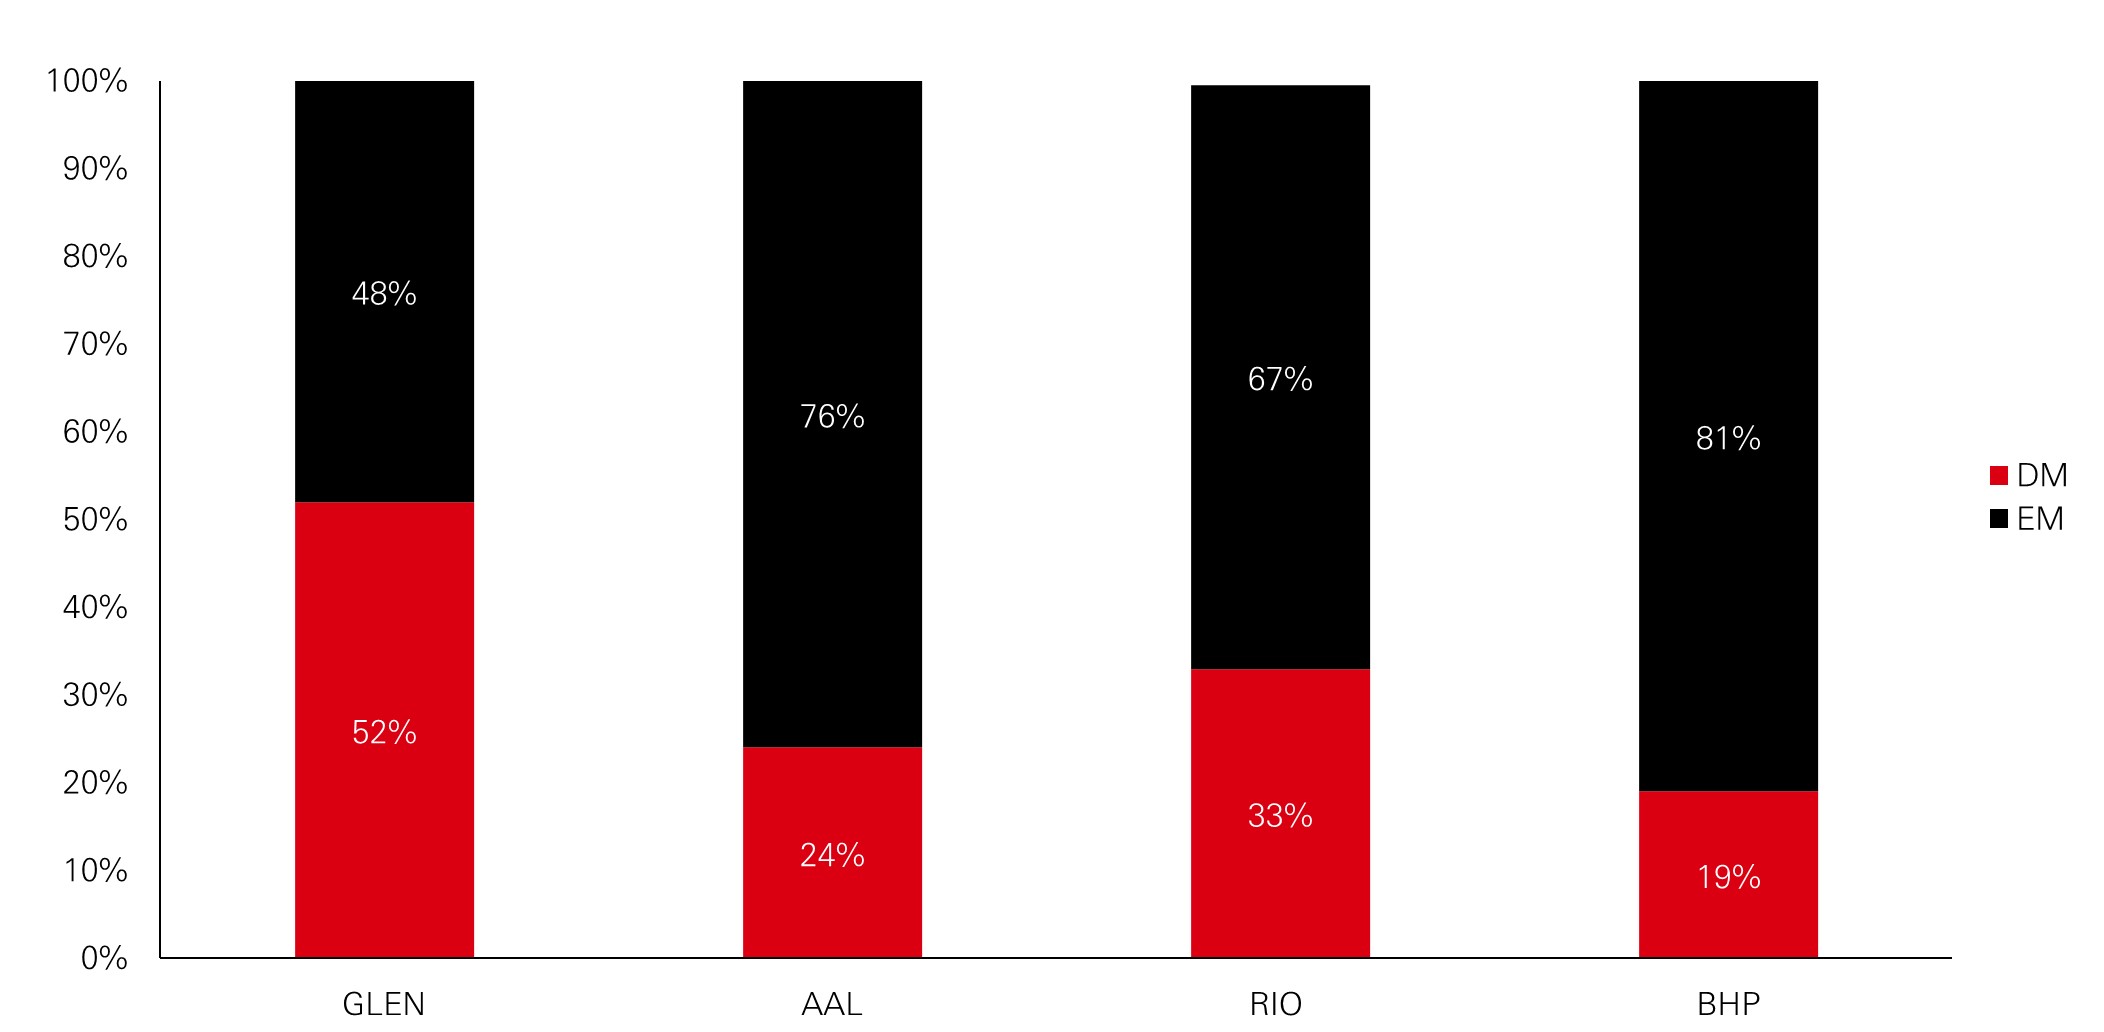
Interestingly, there is a disconnect between where resources are mined and where equity revenue exposure sits. For example, Chile has no copper revenue exposure in its listed equity market, since Codelco – the largest copper miner in the world – is state‑owned. As a result, it is often appropriate to look at DM companies operating in EM countries to get the most direct exposure to the EM commodity theme.
Figure 4: DM listed diversified miners revenue split by geography
Click the image to enlarge
Source: HSBC Asset Management, annual company reports. Data as of end 2025.
The limitations around EM equity exposure to commodities centre on idiosyncratic country risk and corporate governance concerns. Examples include cartel issues in Mexico and governance concerns in Indonesia, which saw it downgraded to frontier status. While there have been improvements in select EM equity markets, it will take time to bring EM to parity with DM standards. Risk management and position sizing become key when expressing this theme via EM.
Outside equities, currencies are arguably a more direct play on the commodity theme. Commodity-orientated currencies in Latin America and EMEA have outperformed during the recent commodity rally. These gains still look quite subdued if we compare against the improvement in terms of trade. More generally, there is potential for a virtuous cycle in these economies: improved trade balances support FX appreciation, which lowers imported inflation and creates room for rate cuts, which in turn supports growth and fiscal outlooks, attracting further inflows.
One way in which fixed income exposures can benefit is via higher metal prices increasing government revenue. This can be done through royalties, corporate taxes on mining profits, and export duties improving fiscal positions and reducing risk premia, which can benefit local bond markets. Countries with high mineral resource rents as a per cent of GDP include Chile, Brazil, South Africa and Indonesia.
Oil vulnerabilities and trade chokepoints
While metals provide a structural tailwind to many EM commodity exporters, oil vulnerability has come sharply into focus, especially for Asian importers. Korea, Taiwan and much of ASEAN (excluding Malaysia) are heavily dependent on imported oil and gas, and rely on political stability in the Middle East and frictionless maritime shipments.
For India and China, oil and gas imports represent a smaller share of GDP, and China’s overall energy mix is less reliant on oil, with heavy coal use gradually giving way to cleaner sources. However, both countries still face significant route dependency: roughly 80 per cent of China’s imported crude passes through the Strait of Malacca, and around 90 per cent of Japan and South Korea’s energy imports transit the same corridor, with Taiwan similarly reliant on seaborne flows.
Recent geopolitical flare‑ups have underlined how fragile these arteries can be. Iranian threats to the Strait of Hormuz, renewed piracy in the South China Sea and around the Strait of Malacca, the 2021 Suez Canal blockage and US efforts to exert greater influence over the Panama Canal all highlight the risk of sudden disruptions. For EM, this creates asymmetric downside for oil importing Asian markets in any prolonged supply shock. Bottom-up differentiation across EM becomes increasingly important.
A more resilient EM landscape, but granularity is key
EM’s appeal today rests on more than dollar weakness. Strong macro fundamentals, improved debt profiles and credible inflation frameworks have reduced vulnerability to risk‑off shocks, while policy rates in many markets remain well above pre‑Covid levels, leaving room to ease as inflation normalises. At the same time, valuations are still compelling: EM FX is heavily undervalued versus the dollar, real yields sit near the top of their 10‑year ranges in key markets, and EM equities trade at a sizeable discount to DM, despite strong earnings momentum in tech and commodity‑heavy indices.
These foundations are reinforced by structural themes. North Asia sits at the heart of the global AI supply chain, whilst China is pushing to establish itself as a self-reliant global leader in AI technology. The Middle East stands out for its rapid adoption of AI, whilst India is racing to attract data centre and AI hub investment. Thanks to these trends, metals‑exporting EMs in Latin America, Africa and Asia stand to benefit from a persistent supply-demand imbalance in critical minerals.
While EMs benefit from powerful structural tailwinds, improving fundamentals and attractive valuations, they represent a highly heterogeneous group of countries that cannot be treated as a single, binary ‘risk‑on/risk‑off’ bloc. This reinforces the case for a selective, active and fundamentals driven approach to the asset class.
Source: HSBC Asset Management, May 2026. The views expressed above were held at the time of preparation and are subject to change without notice. Any forecast, projection or target where provided is indicative only and not guaranteed in any way. HSBC Asset Management accepts no liability for any failure to meet such forecast, projection or target.
Important information
For Professional Clients and intermediaries within countries and territories set out below; and for Institutional Investors and Financial Advisors in the US. This document should not be distributed to or relied upon by Retail clients/investors.
The value of investments and the income from them can go down as well as up and investors may not get back the amount originally invested. The performance figures contained in this document relate to past performance, which should not be seen as an indication of future returns. Future returns will depend, inter alia, on market conditions, investment manager’s skill, risk level and fees. Where overseas investments are held the rate of currency exchange may cause the value of such investments to go down as well as up. Investments in emerging markets are by their nature higher risk and potentially more volatile than those inherent in some established markets. Economies in emerging markets generally are heavily dependent upon international trade and, accordingly, have been and may continue to be affected adversely by trade barriers, exchange controls, managed adjustments in relative currency values and other protectionist measures imposed or negotiated by the countries and territories with which they trade. These economies also have been and may continue to be affected adversely by economic conditions in the countries and territories in which they trade.
The contents of this document may not be reproduced or further distributed to any person or entity, whether in whole or in part, for any purpose. All non-authorised reproduction or use of this document will be the responsibility of the user and may lead to legal proceedings. The material contained in this document is for general information purposes only and does not constitute advice or a recommendation to buy or sell investments. Some of the statements contained in this document may be considered forward looking statements which provide current expectations or forecasts of future events. Such forward looking statements are not guarantees of future performance or events and involve risks and uncertainties. Actual results may differ materially from those described in such forward-looking statements as a result of various factors. We do not undertake any obligation to update the forward-looking statements contained herein, or to update the reasons why actual results could differ from those projected in the forward-looking statements. This document has no contractual value and is not by any means intended as a solicitation, nor a recommendation for the purchase or sale of any financial instrument in any jurisdiction in which such an offer is not lawful. The views and opinions expressed herein are those of HSBC Asset Management at the time of preparation and are subject to change at any time. These views may not necessarily indicate current portfolios' composition. Individual portfolios managed by HSBC Asset Management primarily reflect individual clients' objectives, risk preferences, time horizon, and market liquidity. Foreign and emerging markets: investments in foreign markets involve risks such as currency rate fluctuations, potential differences in accounting and taxation policies, as well as possible political, economic, and market risks. These risks are heightened for investments in emerging markets which are also subject to greater illiquidity and volatility than developed foreign markets. This commentary is for information purposes only. It is a marketing communication and does not constitute investment advice or a recommendation to any reader of this content to buy or sell investments nor should it be regarded as investment research. It has not been prepared in accordance with legal requirements designed to promote the independence of investment research and is not subject to any prohibition on dealing ahead of its dissemination. This document is not contractually binding nor are we required to provide this to you by any legislative provision.
All data from HSBC Asset Management unless otherwise specified. Any third-party information has been obtained from sources we believe to be reliable, but which we have not independently verified.
HSBC Asset Management is the brand name for the asset management business of HSBC Group, which includes the investment activities that may be provided through our local regulated entities. HSBC Asset Management is a group of companies in many countries and territories throughout the world that are engaged in investment advisory and fund management activities, which are ultimately owned by HSBC Holdings Plc. (HSBC Group).
- In Australia, this document is issued by HSBC Bank Australia Limited ABN 48 006 434 162, AFSL 232595, for HSBC Global Asset Management (Hong Kong) Limited ARBN 132 834 149 and HSBC Global Asset Management (UK) Limited ARBN 633 929 718. This document is for institutional investors only and is not available for distribution to retail clients (as defined under the Corporations Act). HSBC Global Asset Management (Hong Kong) Limited and HSBC Global Asset Management (UK) Limited are exempt from the requirement to hold an Australian financial services license under the Corporations Act in respect of the financial services they provide. HSBC Global Asset Management (Hong Kong) Limited is regulated by the Securities and Futures Commission of Hong Kong under the Hong Kong laws, which differ from Australian laws. HSBC Global Asset Management (UK) Limited is regulated by the Financial Conduct Authority of the United Kingdom and, for the avoidance of doubt, includes the Financial Services Authority of the United Kingdom as it was previously known before 1 April 2013, under the laws of the United Kingdom, which differ from Australian laws;
- In Bermuda, this document is issued by HSBC Global Asset Management (Bermuda) Limited, of 37 Front Street, Hamilton, Bermuda which is licensed to conduct investment business by the Bermuda Monetary Authority;
- In France, Belgium, Netherlands, Luxembourg, Portugal, Greece, Finland, Norway, Denmark and Sweden this document is issued by HSBC Global Asset Management (France), a Portfolio Management Company authorised by the French regulatory authority AMF (no. GP99026);
- In Germany, this document is issued by HSBC Global Asset Management (Deutschland) GmbH which is regulated by BaFin (German clients) respective by the Austrian Financial Market Supervision FMA (Austrian clients);
- In Hong Kong, this document is issued by HSBC Global Asset Management (Hong Kong) Limited, which is regulated by the Securities and Futures Commission. This content has not been reviewed by the Securities and Futures Commission;
- In India, this document is issued by HSBC Asset Management (India) Pvt Ltd. which is regulated by the Securities and Exchange Board of India;
- In Italy and Spain, this document is issued by HSBC Global Asset Management (France), a Portfolio Management Company authorised by the French regulatory authority AMF (no. GP99026) and through the Italian and Spanish branches of HSBC Global Asset Management (France), regulated respectively by Banca d’Italia and Commissione Nazionale per le Società e la Borsa (Consob) in Italy, and the Comisión Nacional del Mercado de Valores (CNMV) in Spain;
- In Japan, this document is issued by HSBC Asset Management (Japan) Ltd (JRN 3010001124868), regulated by the Financial Services Agengy;
- In Malta, this document is issued by HSBC Global Asset Management (Malta) Limited which is regulated and licensed to conduct Investment Services by the Malta Financial Services Authority under the Investment Services Act;
- In Mexico, this document is issued by HSBC Global Asset Management (Mexico), SA de CV, Sociedad Operadora de Fondos de Inversión, Grupo Financiero HSBC which is regulated by Comisión Nacional Bancaria y de Valores;
- In the United Arab Emirates, this document is issued by HSBC Investment Funds (Luxembourg) S.A. – Dubai Branch (Level 20, HSBC Tower, PO Box 66, Downtown Dubai, United Arab Emirates) regulated by the Capital Market Authority (CMA) in the UAE to conduct investment fund management, portfolios management, fund administration activities (CMA Category 2 license No.20200000336) and promotion activities (CMA Category 5 license No.20200000327)
- In the United Arab Emirates, this document is issued by HSBC Global Asset Management MENA, a unit within HSBC Bank Middle East Limited, U.A.E Branch, PO Box 66 Dubai, UAE, regulated by the Central Bank of the U.A.E. and the Capital Market Authority in the UAE under CMA license number 602004 for the purpose of this promotion and lead regulated by the Dubai Financial Services Authority. HSBC Bank Middle East Limited is a member of the HSBC Group and HSBC Global Asset Management MENA are marketing the relevant product only in a sub-distributing capacity on a principal-to-principal basis. HSBC Global Asset Management MENA may not be licensed under the laws of the recipient’s country of residence and therefore may not be subject to supervision of the local regulator in the recipient’s country of residence. One of more of the products and services of the manufacturer may not have been approved by or registered with the local regulator and the assets may be booked outside of the recipient’s country of residence
- In Singapore, this document is issued by HSBC Global Asset Management (Singapore) Limited, which is regulated by the Monetary Authority of Singapore. The content in the document/video has not been reviewed by the Monetary Authority of Singapore;
- In Switzerland, this document is issued by HSBC Global Asset Management (Switzerland) AG. This document is intended for professional investor use only. For opting in and opting out according to FinSA, please refer to our website; if you wish to change your client categorization, please inform us. HSBC Global Asset Management (Switzerland) AG having its registered office at Gartenstrasse 26, PO Box, CH-8002 Zurich has a licence as an asset manager of collective investment schemes and as a representative of foreign collective investment schemes. Disputes regarding legal claims between the Client and HSBC Global Asset Management (Switzerland) AG can be settled by an ombudsman in mediation proceedings. HSBC Global Asset Management (Switzerland) AG is affiliated to the ombudsman FINOS having its registered address at Talstrasse 20, 8001 Zurich. There are general risks associated with financial instruments, please refer to the Swiss Banking Association (“SBA”) Brochure “Risks Involved in Trading in Financial Instruments”;
- In Taiwan, this document is issued by HSBC Global Asset Management (Taiwan) Limited which is regulated by the Financial Supervisory Commission R.O.C. (Taiwan);
- In Turkiye, this document is issued by HSBC Asset Management A.S. Turkiye (AMTU) which is regulated by Capital Markets Board of Turkiye. Any information here is not intended to distribute in any jurisdiction where AMTU does not have a right to. Any views here should not be perceived as investment advice, product/service offer and/or promise of income. Information given here might not be suitable for all investors and investors should be giving their own independent decisions. The investment information, comments and advice given herein are not part of investment advice activity. Investment advice services are provided by authorized institutions to persons and entities privately by considering their risk and return preferences, whereas the comments and advice included herein are of a general nature. Therefore, they may not fit your financial situation and risk and return preferences. For this reason, making an investment decision only by relying on the information given herein may not give rise to results that fit your expectations
- In the UK, this document is issued by HSBC Global Asset Management (UK) Limited, which is authorised and regulated by the Financial Conduct Authority;
- In the US, this document is issued by HSBC Securities (USA) Inc., an HSBC broker dealer registered in the US with the Securities and Exchange Commission under the Securities Exchange Act of 1934. HSBC Securities (USA) Inc. is also a member of NYSE/FINRA/SIPC. HSBC Securities (USA) Inc. is not authorized by or registered with any other non-US regulatory authority. The contents of this document are confidential and may not be reproduced or further distributed to any person or entity, whether in whole or in part, for any purpose without prior written permission.
- In Chile, operations by HSBC's headquarters or other offices of this bank located abroad are not subject to Chilean inspections or regulations and are not covered by warranty of the Chilean state. Obtain information about the state guarantee to deposits at your bank or on www.cmfchile.cl;
- In Colombia, HSBC Bank USA NA has an authorized representative by the Superintendencia Financiera de Colombia (SFC) whereby its activities conform to the General Legal Financial System. SFC has not reviewed the information provided to the investor. This document is for the exclusive use of institutional investors in Colombia and is not for public distribution;
- In Costa Rica, the Fund and any other products or services referenced in this document are not registered with the Superintendencia General de Valores (“SUGEVAL”) and no regulator or government authority has reviewed this document, or the merits of the products and services referenced herein. This document is directed at and intended for institutional investors only
- In Peru, HSBC Bank USA NA has an authorized representative by the Superintendencia de Banca y Seguros in Perú whereby its activities conform to the General Legal Financial System - Law No. 26702. Funds have not been registered before the Superintendencia del Mercado de Valores (SMV) and are being placed by means of a private offer. SMV has not reviewed the information provided to the investor. This document is for the exclusive use of institutional investors in Perú and is not for public distribution;
- In Uruguay, operations by HSBC's headquarters or other offices of this bank located abroad are not subject to Uruguayan inspections or regulations and are not covered by warranty of the Uruguayan state. Further information may be obtained about the state guarantee to deposits at your bank or on www.bcu.gub.uy
Copyright © HSBC Global Asset Management Limited 2026. All rights reserved. No part of this publication may be reproduced, stored in a retrieval system, or transmitted, on any form or by any means, electronic, mechanical, photocopying, recording, or otherwise, without the prior written permission of HSBC Asset Management.
Content ID: D070196_V2.0; Expiry date: 30.04.2027.