Fixed Income Insights
In a nutshell
- Private credit’s rapid growth has raised concerns, but the fundamentals and limited scale of business development companies (BDCs) mean it does not currently pose a systemic threat.
- Recent stress has been most evident in non‑traded and semi‑liquid BDCs where liquidity terms and asset liquidity are less well aligned. Even so, underlying loan performance and secondary sale pricing have, to date, generally held up, although non‑accruals and PIK (payment‑in‑kind, where investors receive additional securities rather than cash proceeds) are trending higher.
- US banks’ exposures to private credit are small, senior, secured and over‑collateralised, with strong transparency and risk‑management tools, so losses are more likely to hit equity and subordinated layers than threaten bank solvency.
- US life insurers, especially PE‑backed platforms, are major allocators to private credit and other illiquid assets via vertically integrated and offshore structures, boosting yield but adding concentration, governance and transparency risks.
- Stress tests for life insurers show severe shocks can materially erode RBC (risk based capital) ratios and trigger rating pressure, though capital should remain above regulatory intervention levels, while European and UK insurers have smaller, more diversified private credit allocations and stricter regulation.
Private Credit: Systemic Risk?
Private Credit is generating negative headlines, but fundamentals are generally sound and our view is that we are not close to a systemic threat. Concerns have coalesced around illiquidity and AI disruption risk, the former being an integral feature of the asset class, while the latter is sector- specific and manageable, even if it may cause pockets of distress and contagion.
Recent dislocations in the US business development company (BDC) market are better characterised as liquidity and confidence stresses in vehicles that pair illiquid assets with an increasingly retail-oriented funding base, rather than evidence of material credit deterioration.
Private credit’s rapid expansion over the past decade has reshaped the lending environment as banks have retreated from certain forms of corporate credit intermediation, while long term investors have increasingly sought to harvest the illiquidity premium such assets can offer. Recent stresses in parts of the market, however, have made it a focal point for both investors and regulators, and speculation that private credit may become a source of systemic instability.
But its scale relative to the broader credit system remains more modest than often perceived, BDCs account for just USD0.5 trillion of assets, or around 12.5 per cent of the USD4 trillion US leveraged finance market, itself less than a quarter of the size of the US public corporate bond market. Moreover, BDCs operate under regulatory caps of 2.0x debt-to-equity, with actual leverage typically around 1.0–1.2x, leaving significant headroom to absorb losses. This contrasts with previous bank lending cycles, where leverage often built up more aggressively and without comparable constraints.
The number of BDCs is relatively small – at around 170 – and importantly for bond investors, only around 34 have index eligible public debt. Once prudent screening criteria are applied – such as track record, portfolio diversification and risk management – our investable universe narrows further to only around a dozen BDCs. This reflects our belief that outcomes in private credit are less about accessing the asset class itself and more about selecting the right managers, where the quality of underwriting is the important differentiator.
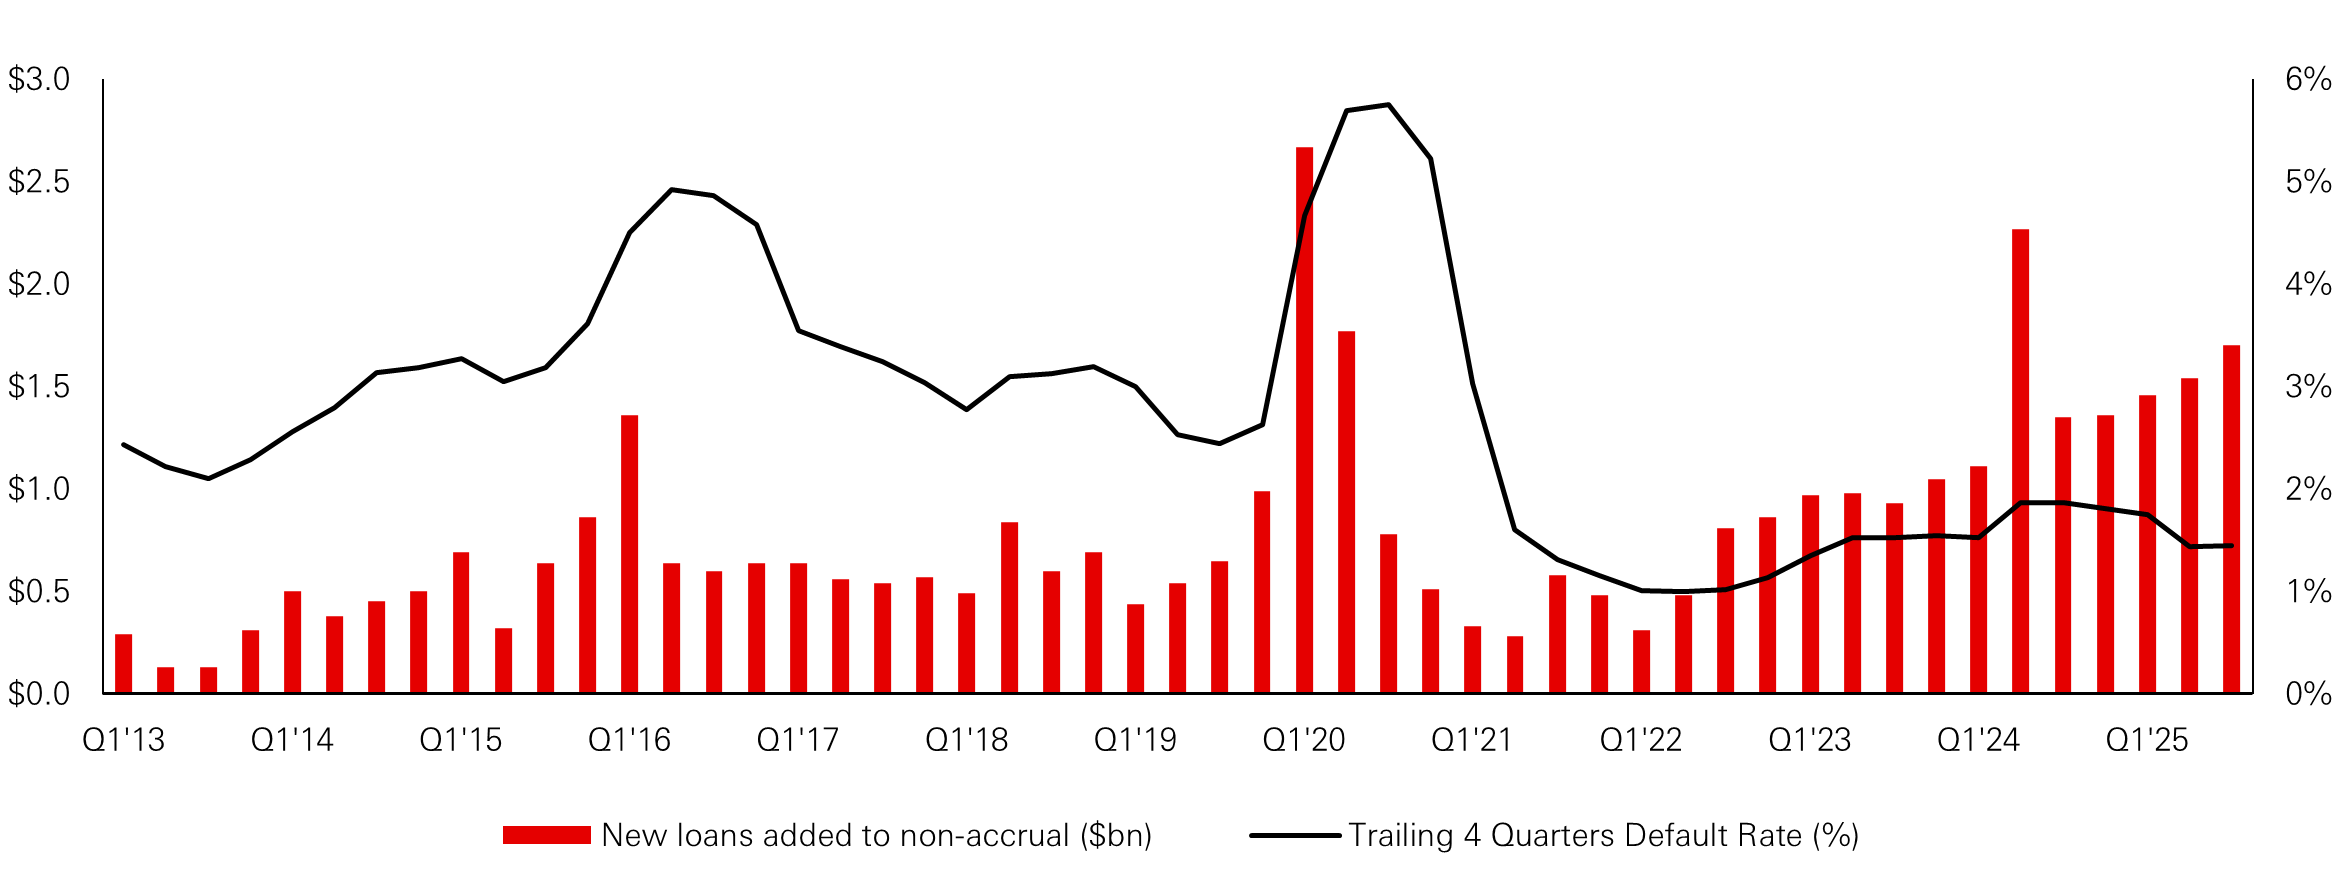
Figure 1: Non-accrual loans and default rates
Click the image to enlarge
Source: HSBC Alternatives, Bloomberg, Cliffwater LLC, as of Q3 2025.
The recent pressure has been concentrated in non‑traded and semi‑liquid BDCs which offer periodic redemptions to investors while investing predominantly in private, illiquid loans, creating an inherent liquidity mismatch which becomes problematic when redemptions rise sharply. This came to the fore after a series of idiosyncratic events, starting with a contentious merger of two BDCs that triggered elevated outflows, followed by sizable redemption waves at other large non‑traded vehicles, some of which chose to fully honour redemptions in excess of their 5 per cent quarterly thresholds, while most of the semi-liquid BDCs invoked their redemption gate, a feature built into all such funds to protect existing investors by preventing forced sales of inherently illiquid assets.
In practice, these episodes have forced managers to choose between using balance sheet capacity – via higher leverage or liquid investments such as syndicated loans – to meet redemptions or enforcing structural protections to preserve portfolio integrity. Where leverage headroom and liquid assets were available, managers could absorb outflows and even use the situation to move closer to target leverage and increase the share of core direct‑lending assets; where portfolios were already near target parameters, the more prudent response was to gate.
For now, loan performance appears to have been more nuanced than the headlines alone might imply, though first-quarter earnings trends point to some softening and outcomes remain deal-specific. Where BDCs have sold assets in the secondary market to meet liquidity needs, trades have generally cleared around par or at modest discounts broadly in line with stated fair values—pricing that likely reflects BDCs’ structuring features rather than uniformly strong underlying collateral performance. Default rates remain broadly stable, though there is a clear upward drift in non‑accruals and increased use of payment-in-kind (PIK), where investors receive more securities rather than cash proceeds, which are important early‑warning indicators. The rise in non‑accruals has been gradual rather than spiky, leaving aggregate levels well below those seen during the pandemic or the global financial crisis, and still manageable in relation to current spreads and coverage metrics. PIK usage needs to be analysed carefully, distinguishing contractual or “good” PIK agreed at inception from “bad” PIK that reflects emerging payment stress, but the data to date do not point to a broad‑based break in credit quality.
Although private credit remains predominantly an institutional market – roughly two‑thirds or more of capital in US direct lending still comes from institutions – the growth of non‑traded and semi‑liquid BDCs has introduced a sizeable retail and private‑wealth component with expectations of periodic liquidity. Regulators in both the US and Europe are watching these developments closely, particularly given the broader theme of “democratisation” of private markets (which some regulators deem to be desirable), and the main medium‑term risk for the BDC complex may be tighter rules or constraints on retail‑facing products rather than systemic credit losses.
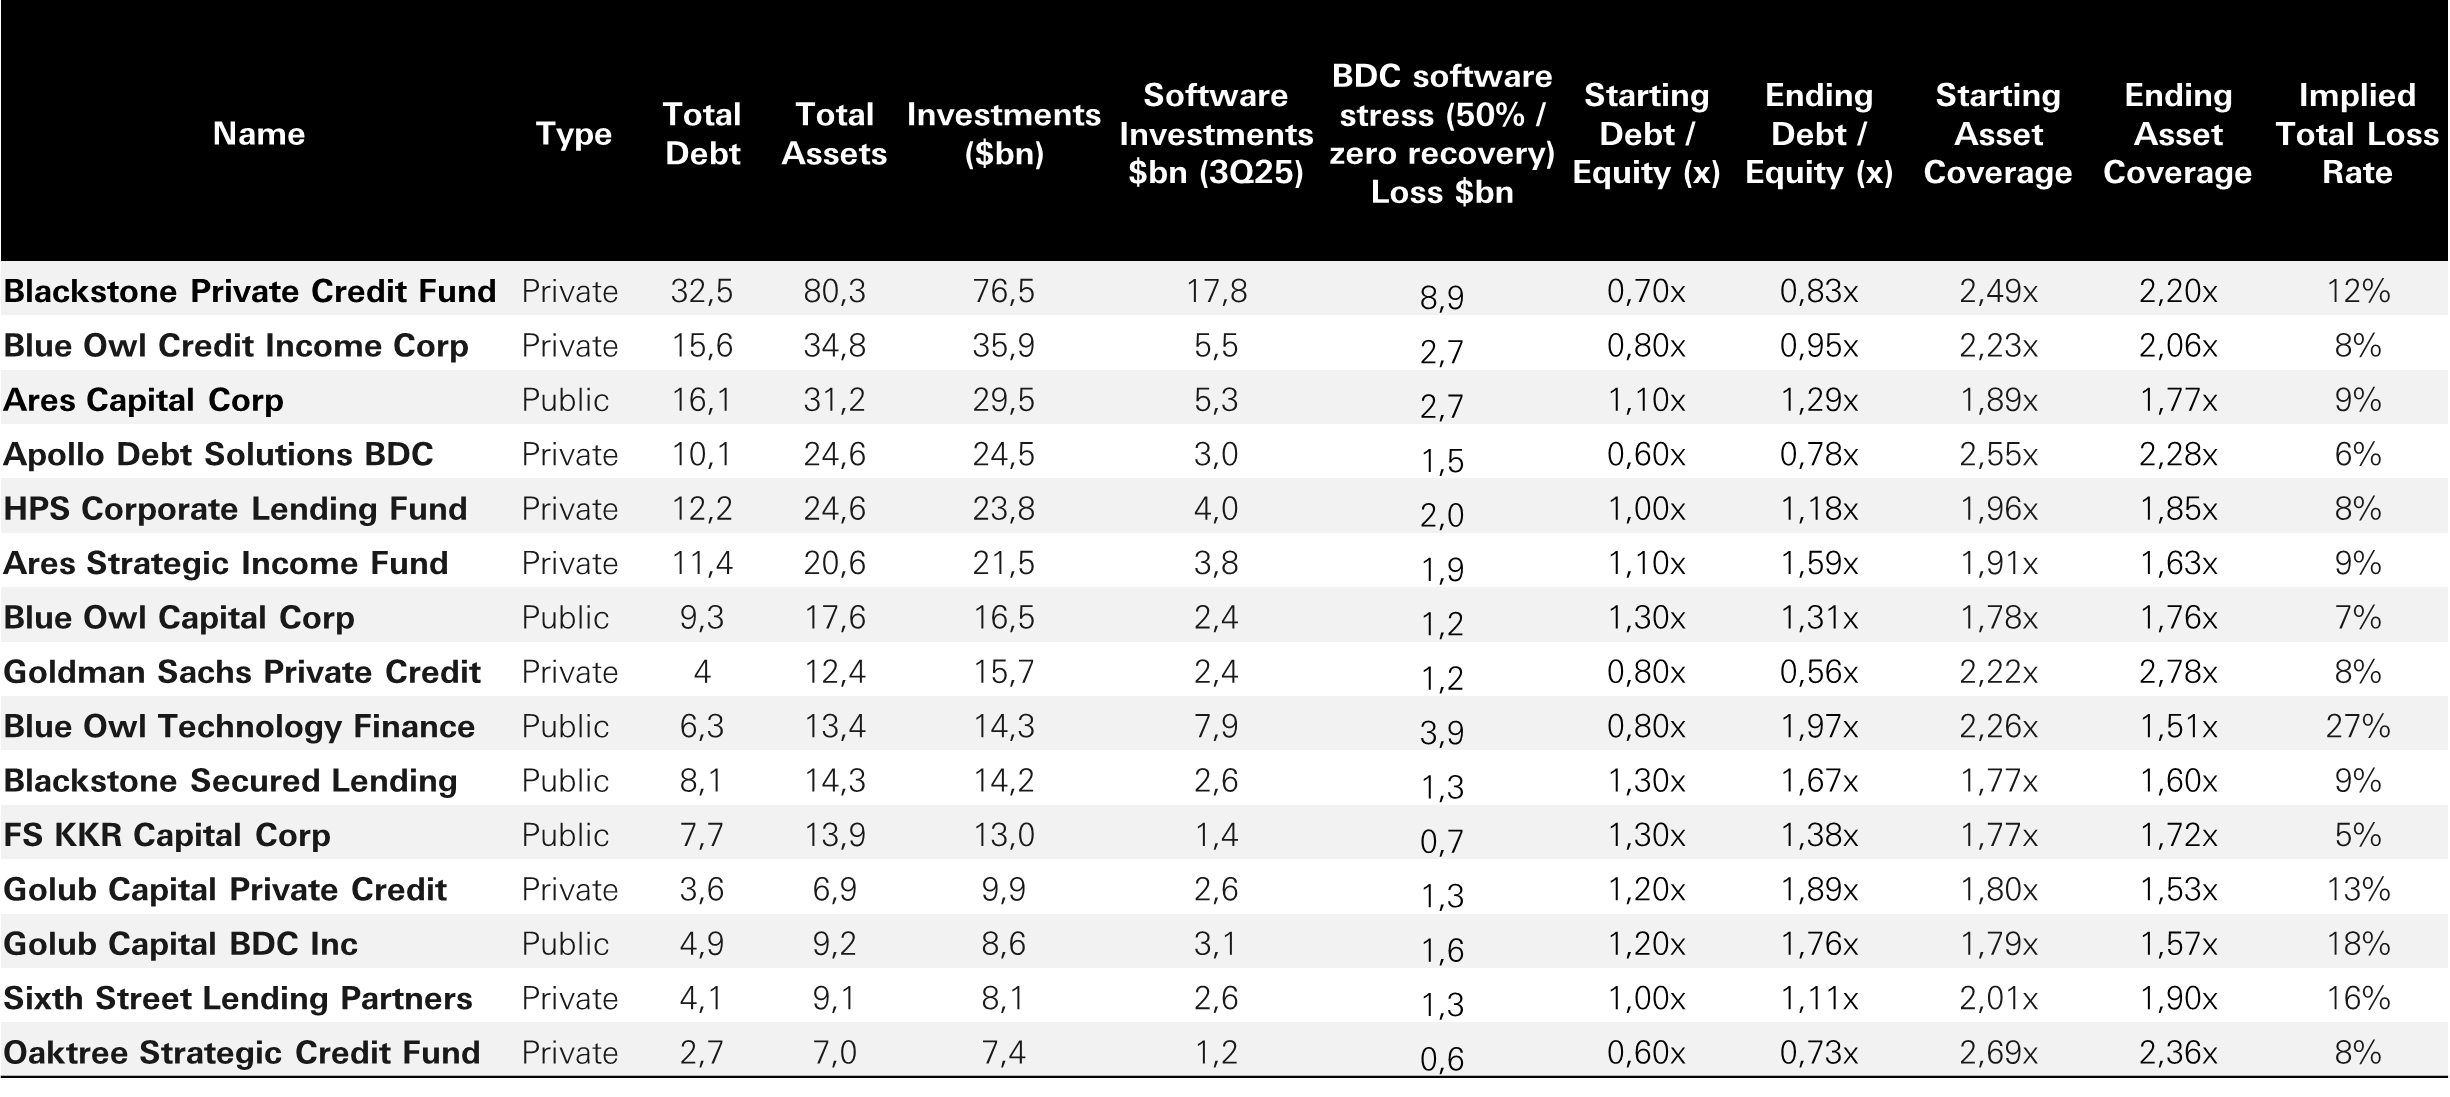
Meanwhile, technology and software exposure has become a focal point, given the AI boom and its potential disruption to these sectors. A severely adverse stress loss scenario which applies a 50 per cent stress with zero recovery to software investments across the 15 largest BDCs, produces materially different implied loss rates and post-stress asset coverage outcomes. The dispersion is meaningful: some vehicles show single-digit implied total loss rates with ending asset coverage still comfortably above minima, while others with higher software concentration show much larger implied losses and a sharper deterioration in asset coverage. The conclusion is that sector concentration can amplify downside in a severe shock, and resilience varies significantly by vehicle.
Figure 2: BDCs Stress Analysis
Click the image to enlarge
Source: HSBC Alternatives, Bloomberg, Cliffwater LLC, as of Q3 2025.
US bank exposure to private credit has grown rapidly but remains small relative to total loans and is typically senior, secured, and over‑collateralised. Transparent underlying data and strong structural protections mean losses are likely absorbed by junior capital, limiting systemic contagion.
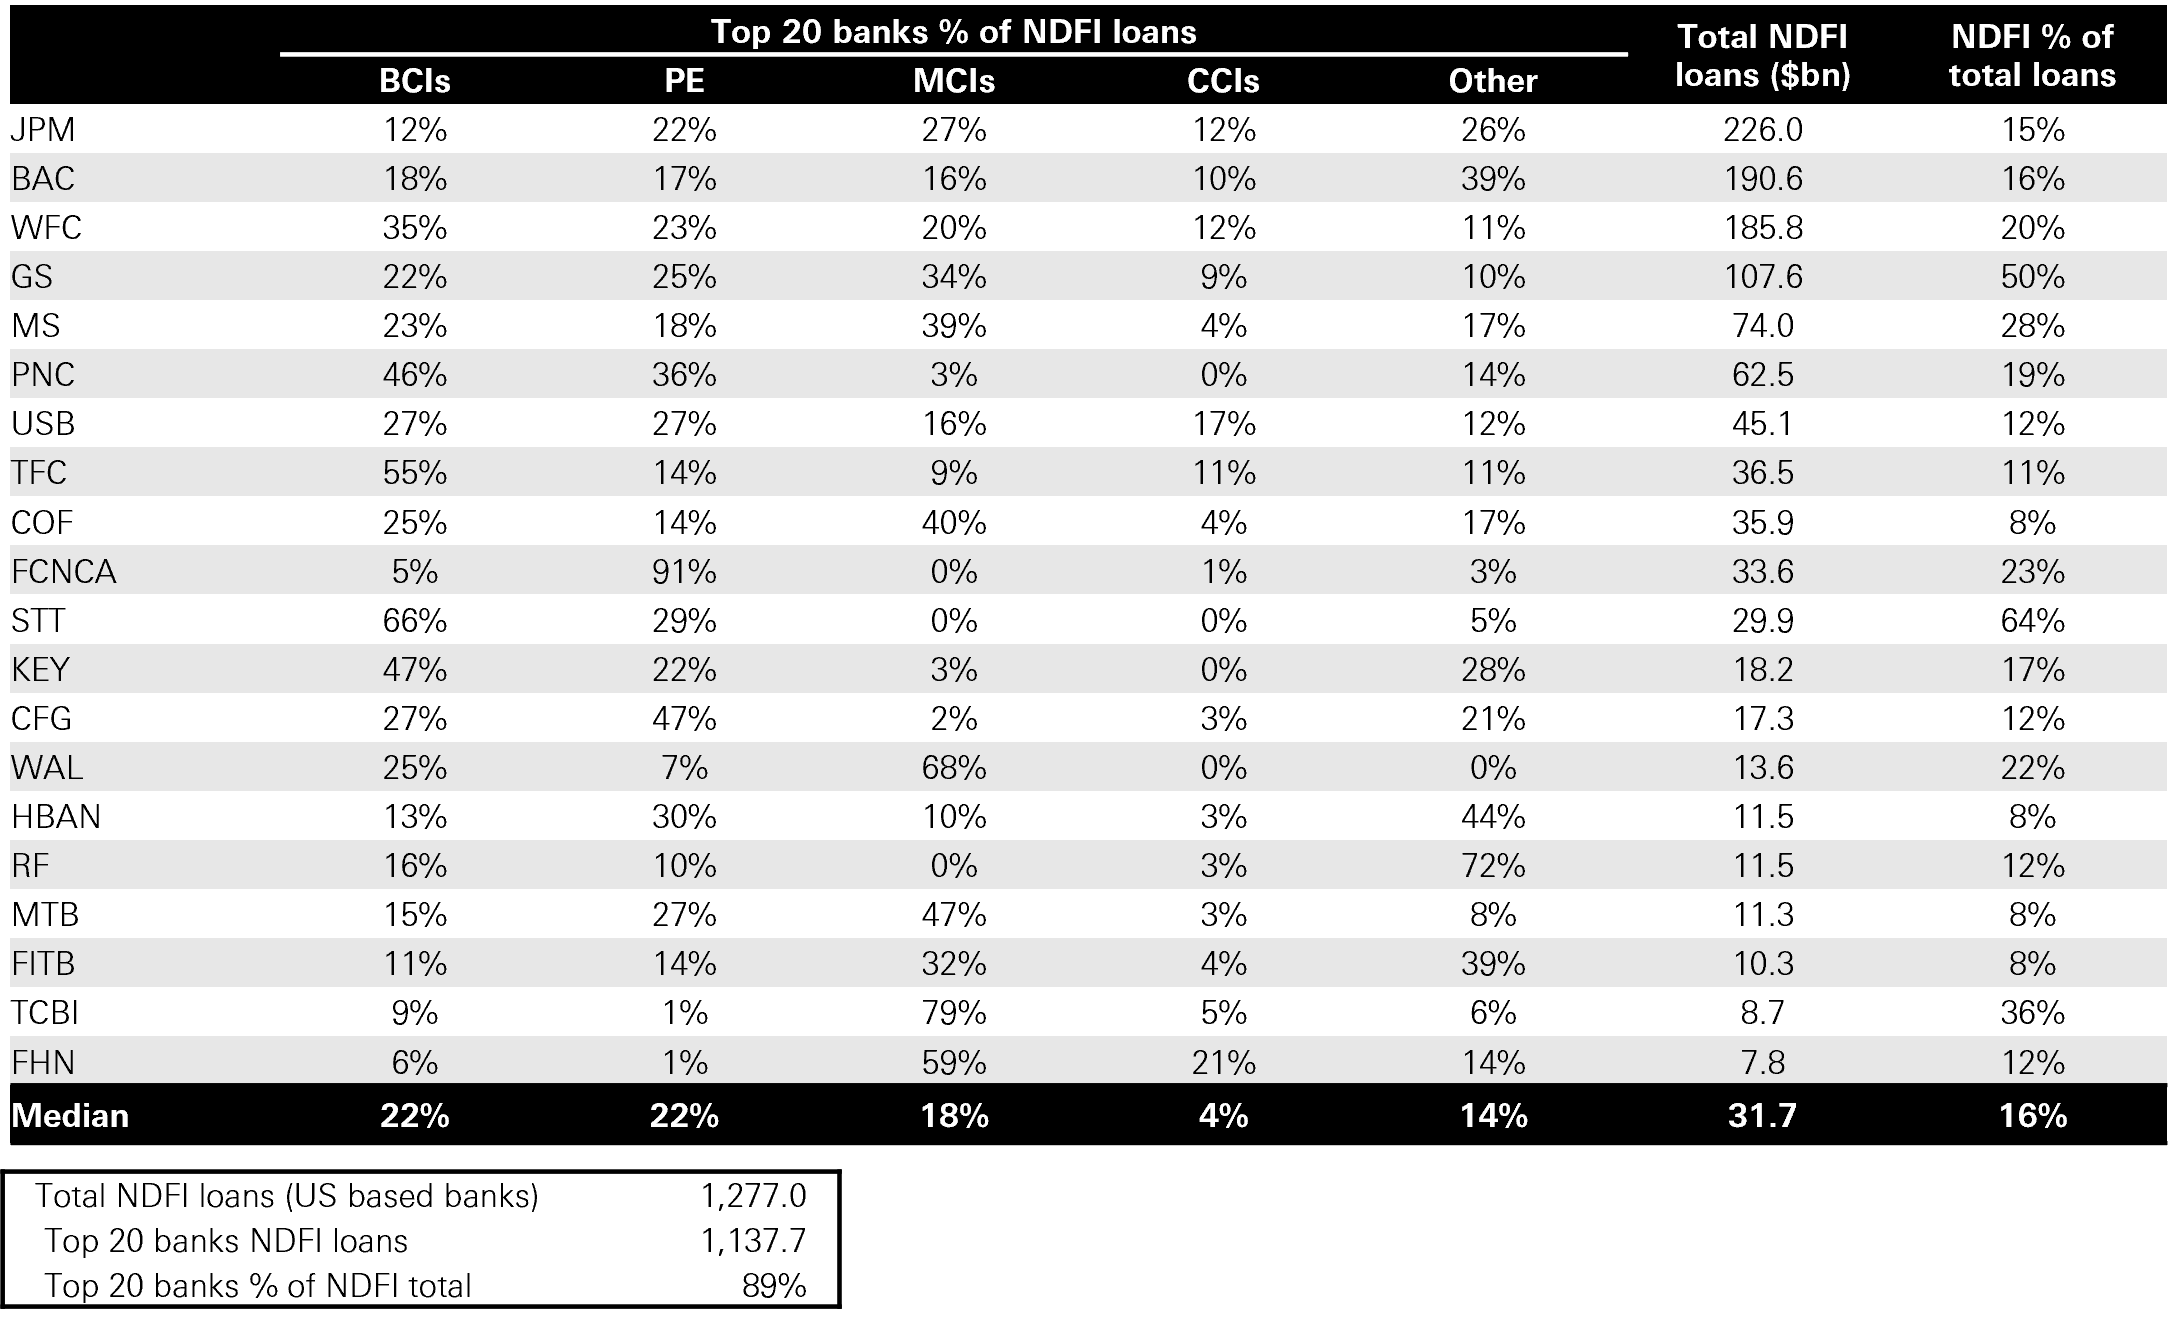
US banks’ exposure to private credit is primarily captured through lending to non-depository financial institutions (NDFIs), a category that includes BDCs, private debt funds and securitisation vehicles. Following the global financial crisis, regulators began requiring banks to report NDFI exposures from 2010 onwards. During 2010 to 2024, these exposures have grown at an annual compound rate of around 20–21 per cent, making it the fastest growing segment of bank loan books.
However, the absolute exposure remains modest. Even for large banks, lending to business credit intermediaries typically represents a mid‑teens share of NDFI exposures on average and a low single digit percentage of total loan portfolios. For example, exposures may account for roughly 2 per cent of total loans in large institutions, limiting the potential for system wide spillovers.
Figure 3: Within NDFI lending, private credit represents less than 25 per cent of total exposure among the largest players
Click the image to enlarge
Source: HSBC Asset Management, data as of 4Q 2025.
Importantly, these exposures are structurally protected. Bank lending to private credit vehicles is typically conducted through senior secured revolving credit facilities, backed by collateral pools of underlying loans. These facilities are subject to significant over-collateralisation, with advance rates often in the 60–80 per cent range, depending on asset quality and leverage.
Banks also benefit from full transparency on underlying loan performance, including borrower level leverage of around 5.9x and interest coverage of around 1.8x as of Q3 2025. This enables active risk management, including the ability to adjust advance rates, request additional collateral or reduce exposure if conditions deteriorate.
From a loss perspective, this positioning is critical. In stressed scenarios, losses are more likely to be absorbed at the equity or unsecured layers of the capital structure, leaving senior secured lenders, including banks, relatively protected. This significantly reduces the likelihood of contagion through the banking system.
US life insurers, especially private equity‑backed platforms, are increasingly allocating to private credit and other illiquid assets which add yield but increase risk, often via vertically integrated and offshore structures. Stress tests indicate capital and rating pressure under severe shocks, but limited near‑term solvency risk, with US risks exceeding Europe/UK.
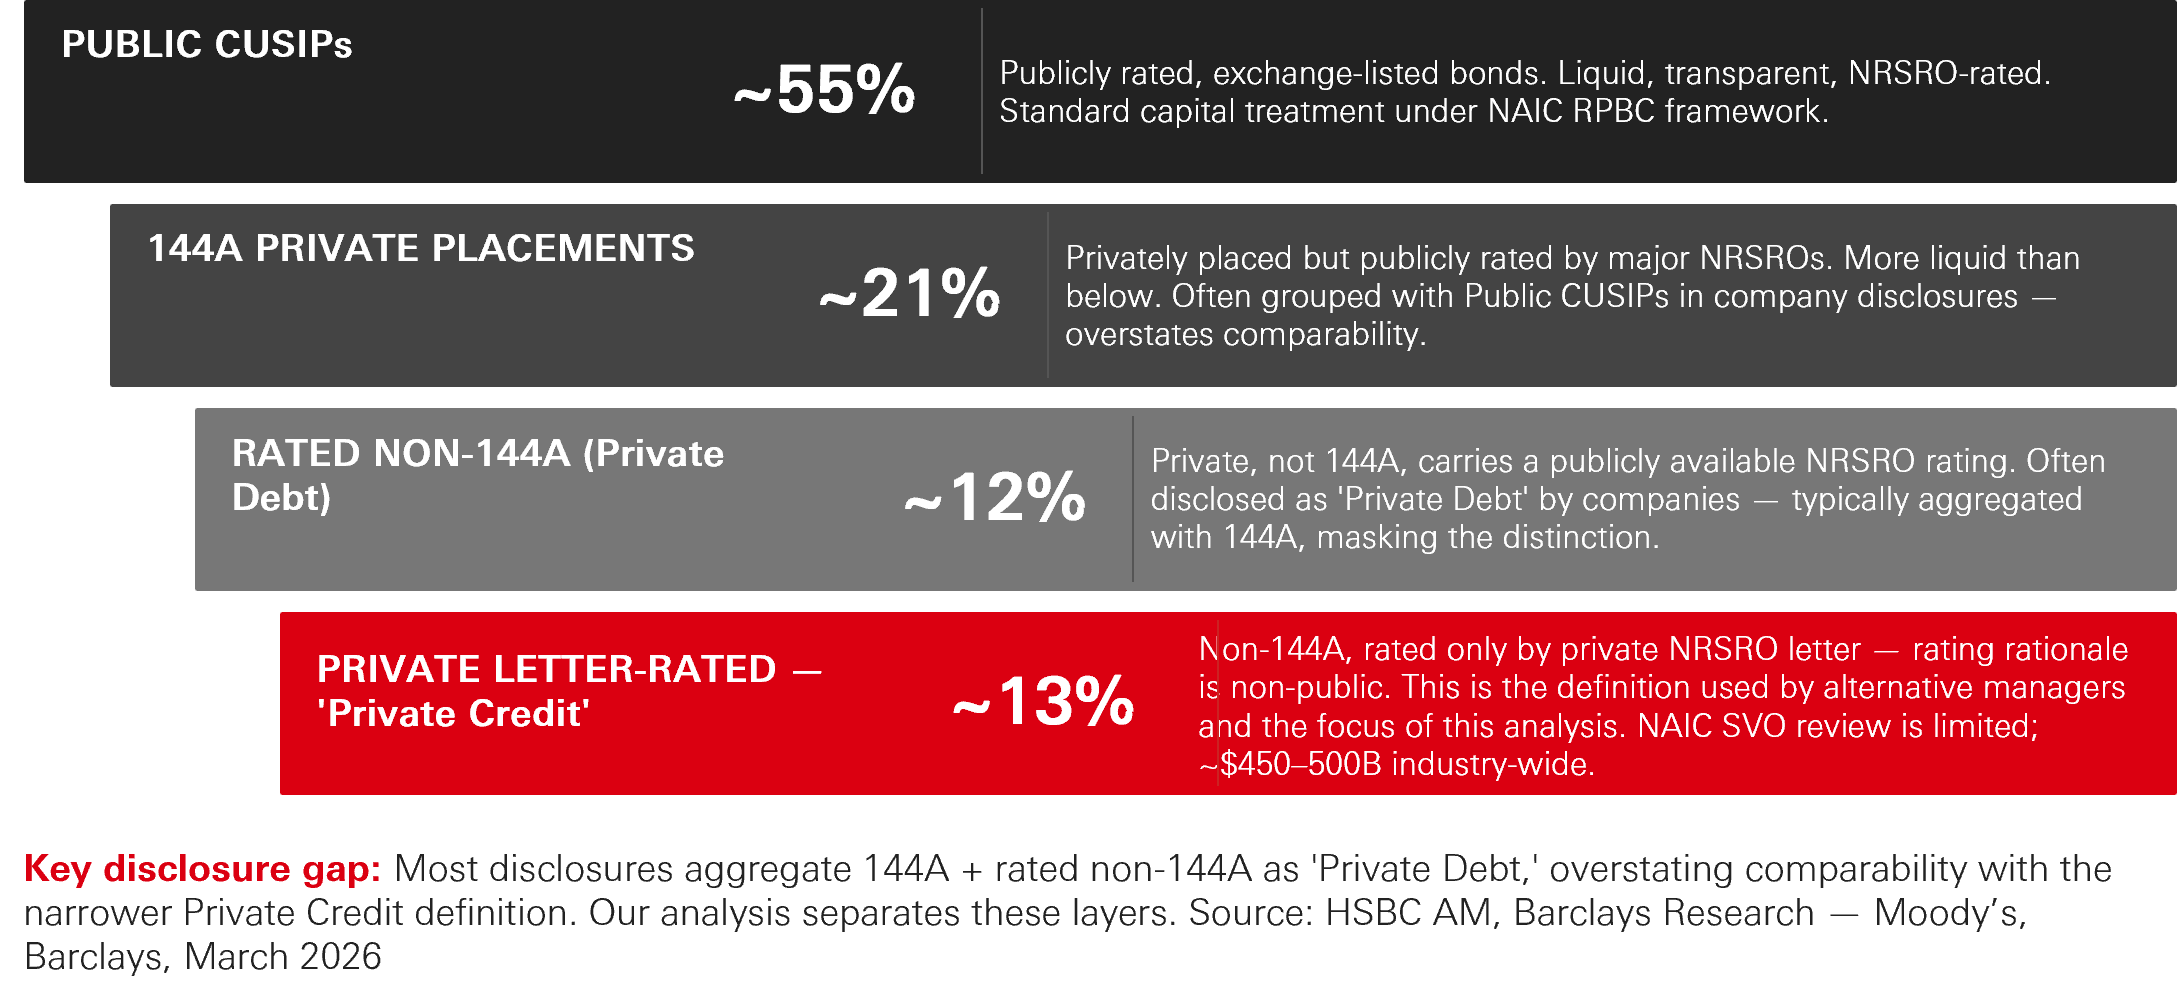
In the US, private equity backed insurance platforms have become major allocators to private credit, driven by the economics of annuity products. While public bonds still account for roughly 55 per cent of portfolios, around 20–25 per cent sits in private placements, which are often included in headline ‘private debt’ figures. However, the most rapid growth – and the focus of current scrutiny – lies in two smaller but expanding segments which are rated non-144A private debt and private letter-rated credit, where ratings are not publicly disclosed.
Figure 4: What Is 'Private Credit' in Life Insurance?
Click the image to enlarge
Source: HSBC Asset Management, data as of 4Q 2025.
Figure 5: The PE-Backed Insurer Model

Click the image to enlarge
Source: FSOC 2024 Annual Report; AM Best - PE-Backed Life Insurers: Risk Considerations 2023; Public insurer investment management agreement disclosures.
Fixed annuities are fundamentally a spread-based business. As a result, higher-yielding assets become particularly attractive, and private credit can offer a yield premium versus similarly rated public credit.
The appeal is straightforward. Private credit and related strategies have offered meaningful yield and total return premia over comparably-rated public credit, reflecting illiquidity and complexity premia that have persisted across rate environments. For investors with long-dated, predictable liabilities, those characteristics can align well with asset-liability needs, and the asset class has grown into a core allocation for a wide range of institutional portfolios – pensions, endowments, sovereign wealth funds, and insurers among them.
Within the insurance channel specifically, private equity-affiliated platforms have been a notable feature of the growth story. In these structures, a sponsor typically acquires an insurer or block of liabilities, and an affiliated asset manager directs general account investments – often into assets sourced through the sponsor's broader origination platform. The model has supported strong AUM and premium growth for participating platforms, though it has also prompted ongoing engagement with regulators and rating agencies on questions of affiliated-asset concentration, private rating practices, and transparency– areas where industry standards continue to evolve
Included in the growing allocation of private credit are more complex instruments like middle market CLOs, various ABS structures, and alternative assets. These instruments offer additional yield and returns but are inherently less transparent and liquid, which raises questions around performance under stress scenarios.
Figure 6: Broader illiquid exposure as per cent of total investments
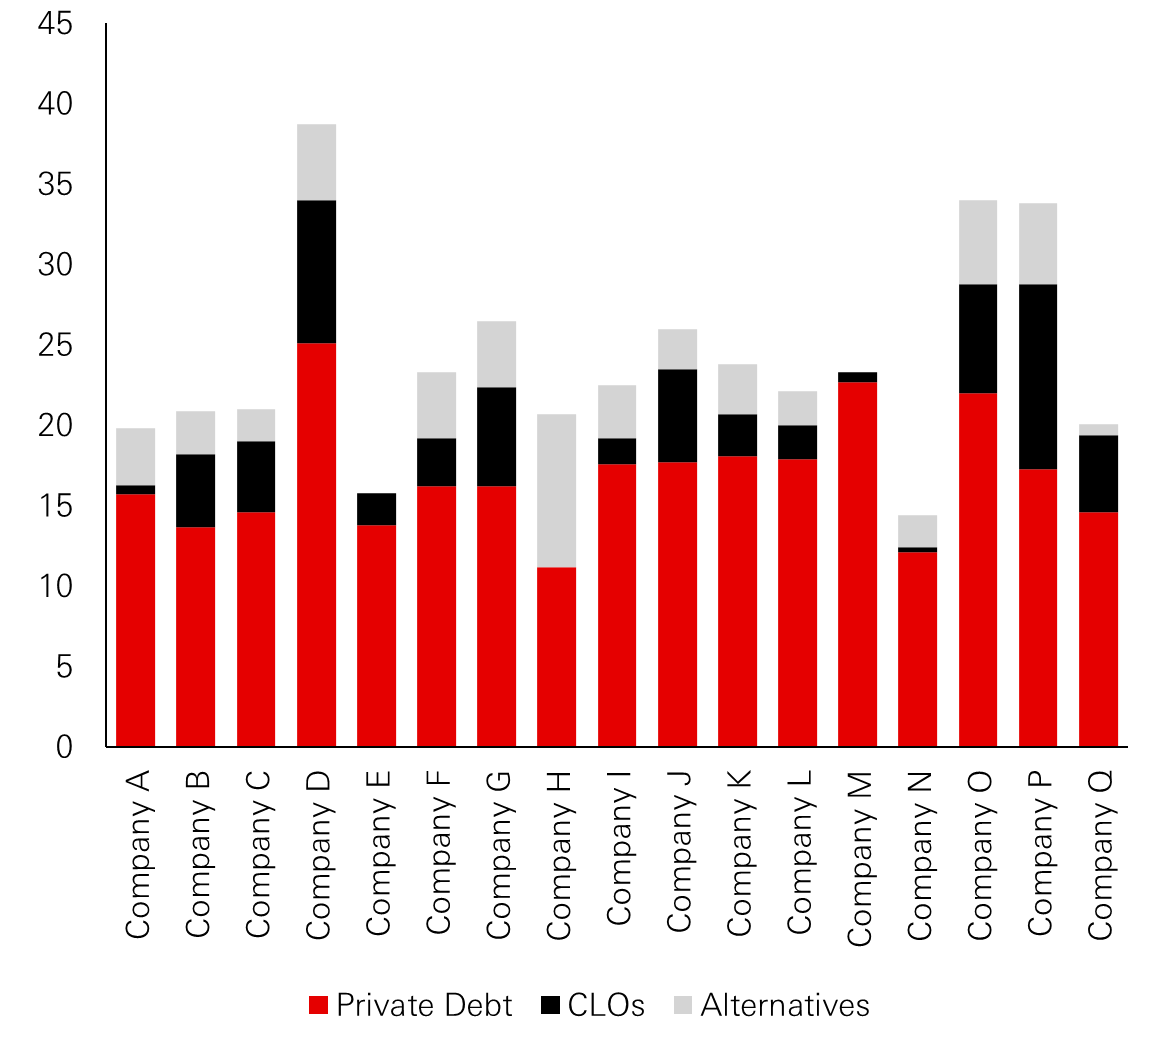
Click the image to enlarge
Figure 7: Broader illiquid exposure as per cent of equity (ex. accumulated other comprehensive income)
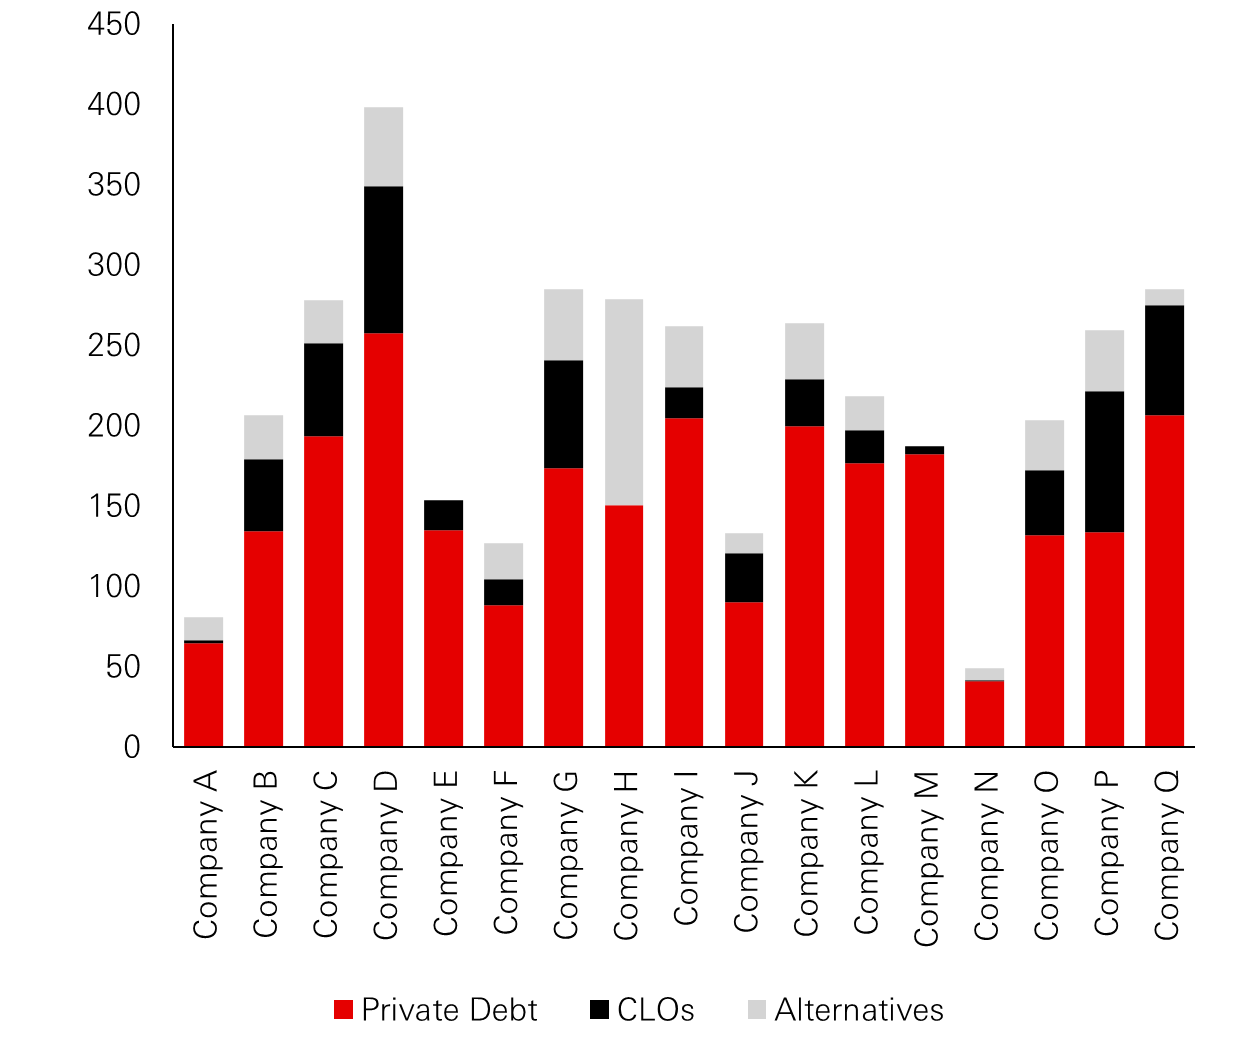
Click the image to enlarge
Companies A, B, C, etc. refer to major US-listed insurance companies and are shown in no particular order.
Source: HSBC Asset Management, Company Reports, Morgan Stanley, Barclays, March 2026.
The key question, therefore, is how these structures behave under stress. One way to frame this is through risk-based capital (RBC) analysis, which measures insurer capital relative to regulatory minimums. Although RBC ratios across insurers vary due to liability and investment mix, a typical annuity-focused insurer often operates with an RBC ratio of around 400 per cent, implying capital of roughly four times the regulatory requirement. We note that rating agencies require materially higher minimum levels for any given rating.
Under a hypothetical severe stress scenario – incorporating rating downgrades, punitive impairments across private credit and structured assets, and conservative assumptions for lower-quality exposures – RBC ratios could decline materially. For example, in a scenario broadly analogous to the global financial crisis, an insurer with higher allocations to private credit and alternatives could see its RBC ratio fall from just above 400 per cent to the mid 200 per cent range, assuming concerns around credit quality and ratings inflation are realized and lead to underperformance versus public credit. Such an outcome would likely trigger rating pressure and could constrain the insurer’s ability to write new business. In response, insurers may have mitigating actions available, including limiting dividends, slowing growth, and, where feasible, raising capital. While these scenarios are shocks and rely on broad assumptions around ratings migration and impairment levels, most insurers typically maintain capital levels above regulatory requirements.
This distinction is important: even under severe stress, the analysis points to pressure on capital and ratings rather than immediate solvency risk. Insurers with more moderate allocations to illiquid assets would be expected to experience smaller declines, reinforcing the importance of portfolio composition and diversification.
That said, this stability is not absolute. In more severe scenarios – particularly if accompanied by further downgrades or a loss of confidence – policyholder behaviour could shift, potentially increasing liquidity demands. While not the base case, this remains a key tail risk.
From a regional perspective, the US stands apart. In Europe and the UK, private credit allocations are generally smaller (often around 10–20 per cent of portfolios) and more diversified across asset types, including mortgages and infrastructure lending. In addition, supervisory data suggest illiquid exposures remain manageable. As a result, while similar conceptual concerns exist, private credit is generally being monitored rather than viewed as a near-term systemic risk in European insurance markets.
Source: HSBC Asset Management, May 2026. The views expressed above were held at the time of preparation and are subject to change without notice. Any forecast, projection or target where provided is indicative only and not guaranteed in any way. HSBC Asset Management accepts no liability for any failure to meet such forecast, projection or target.