US inflation: Sticky or stuck?
Cooling labour markets and softer shelter costs contrast with tariff driven goods stickiness and oil uncertainty, pointing to US core inflation drifting towards 2 per cent only slowly, with 2 per cent acting more as a floor than an average
A practical US inflation forecasting process splits core inflation into labour, housing and goods, then adds food and energy.
A central question for the US this year is whether inflation proves merely “sticky” around current levels or becomes “stuck” materially above the Federal Reserve’s 2 per cent target.
A simple way to frame the US inflation outlook is to split core inflation into three domestic drivers – labour, housing and goods – and then add food and energy to derive headline inflation. Traditional large macro models based on the output gap have struggled to predict inflation accurately, while highly granular models often work only because errors across hundreds of CPI components offset each other. The streamlined framework focuses on how unit labour costs drive core services ex‑shelter, how the housing market feeds into shelter inflation given its large weight in CPI and PCE, and how globally determined goods prices transmit external shocks into domestic inflation, with energy, particularly oil, now heavily influenced by Middle East geopolitics.
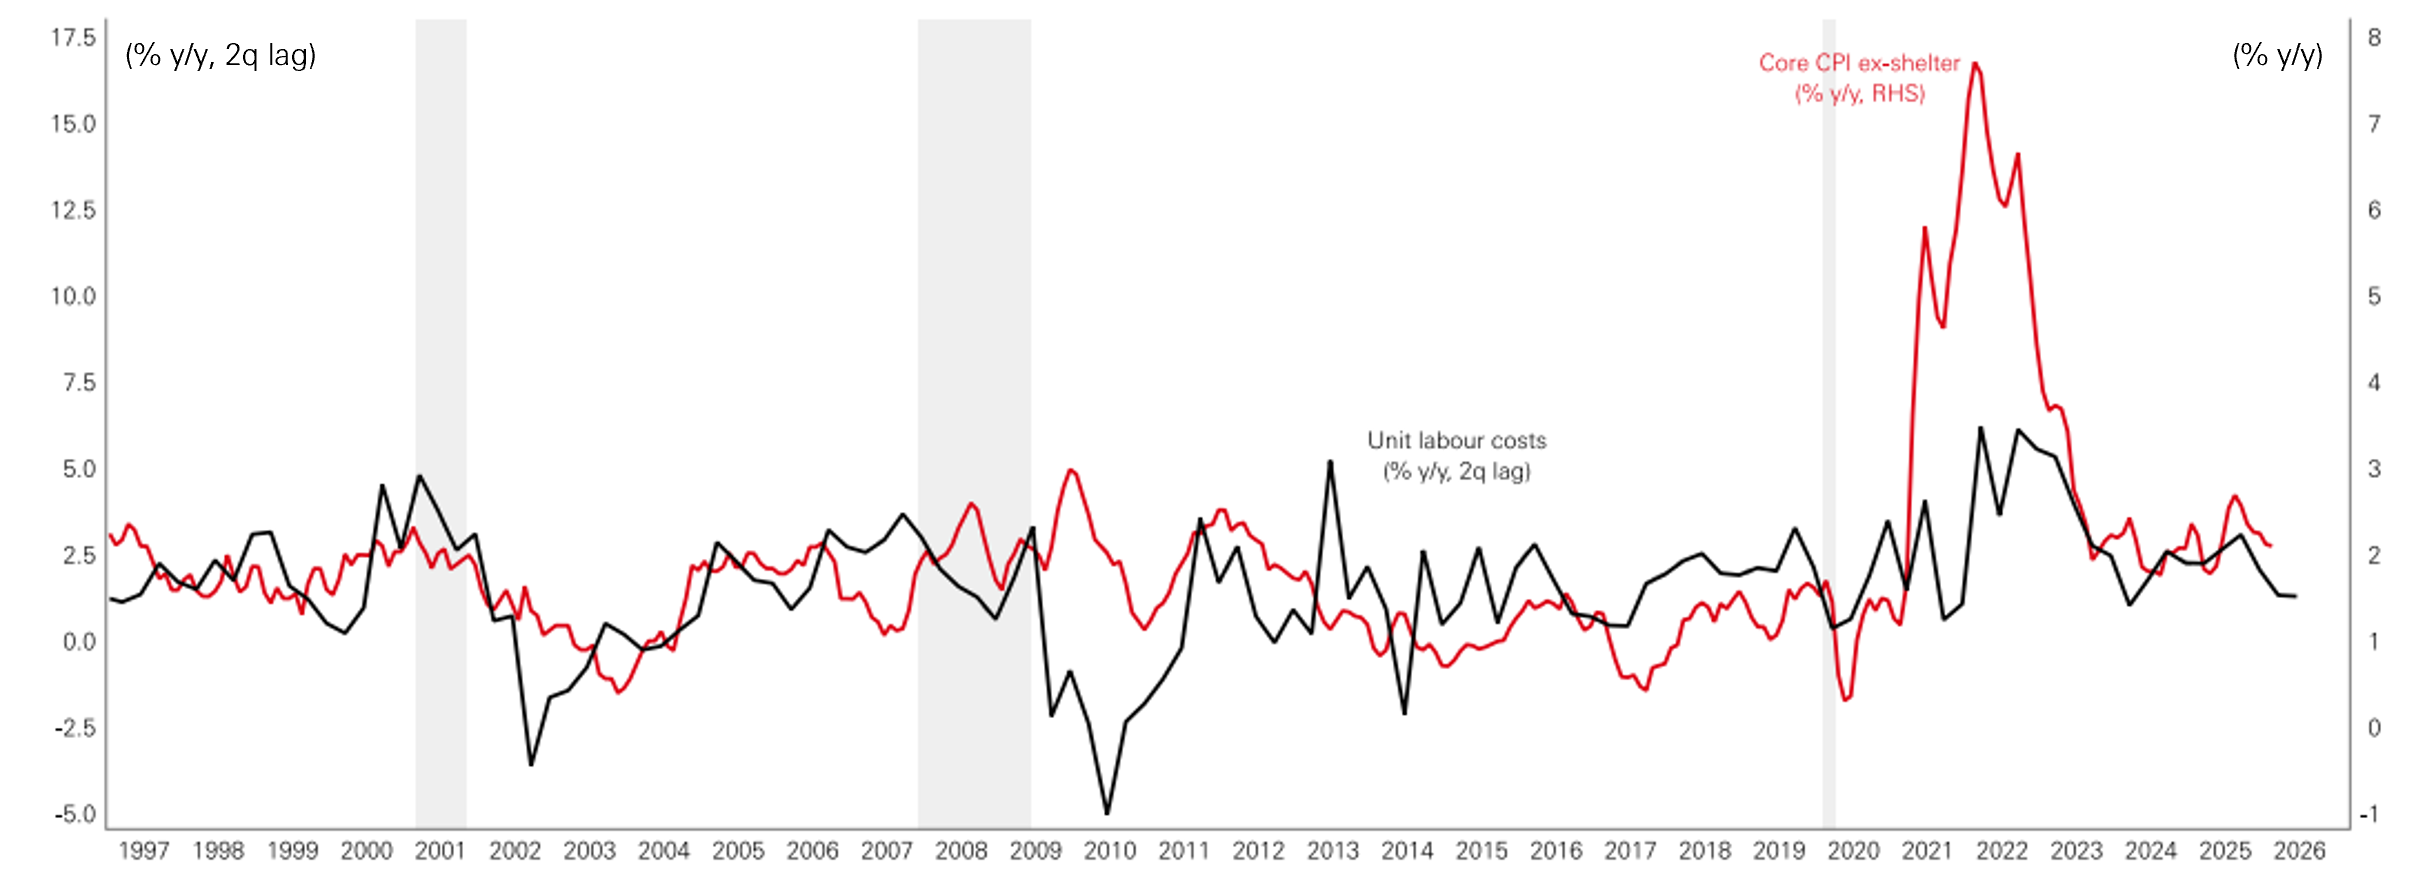
Unit labour costs have historically been a good guide to the underlying trend in US core inflation excluding shelter, with 2021–2022 a notable exception when aggressive policy stimulus allowed margins and prices to rise faster than labour costs. Over the last one to two years, the labour market has cooled, wage growth has moderated and productivity has rebounded, resulting in relatively subdued unit labour cost growth.
Figure 1: Slow employment growth and moderating wages
Click the image to enlarge
Source: Macrobond, HSBC AM, March 2026.
These developments point to limited labour‑market‑driven inflation pressure over the next twelve months. A repeat of the 2021–2022 pattern, where policy settings enabled a decoupling of inflation from labour costs, appears unlikely given only modest fiscal easing and a Federal Reserve that is not signalling aggressive rate cuts.
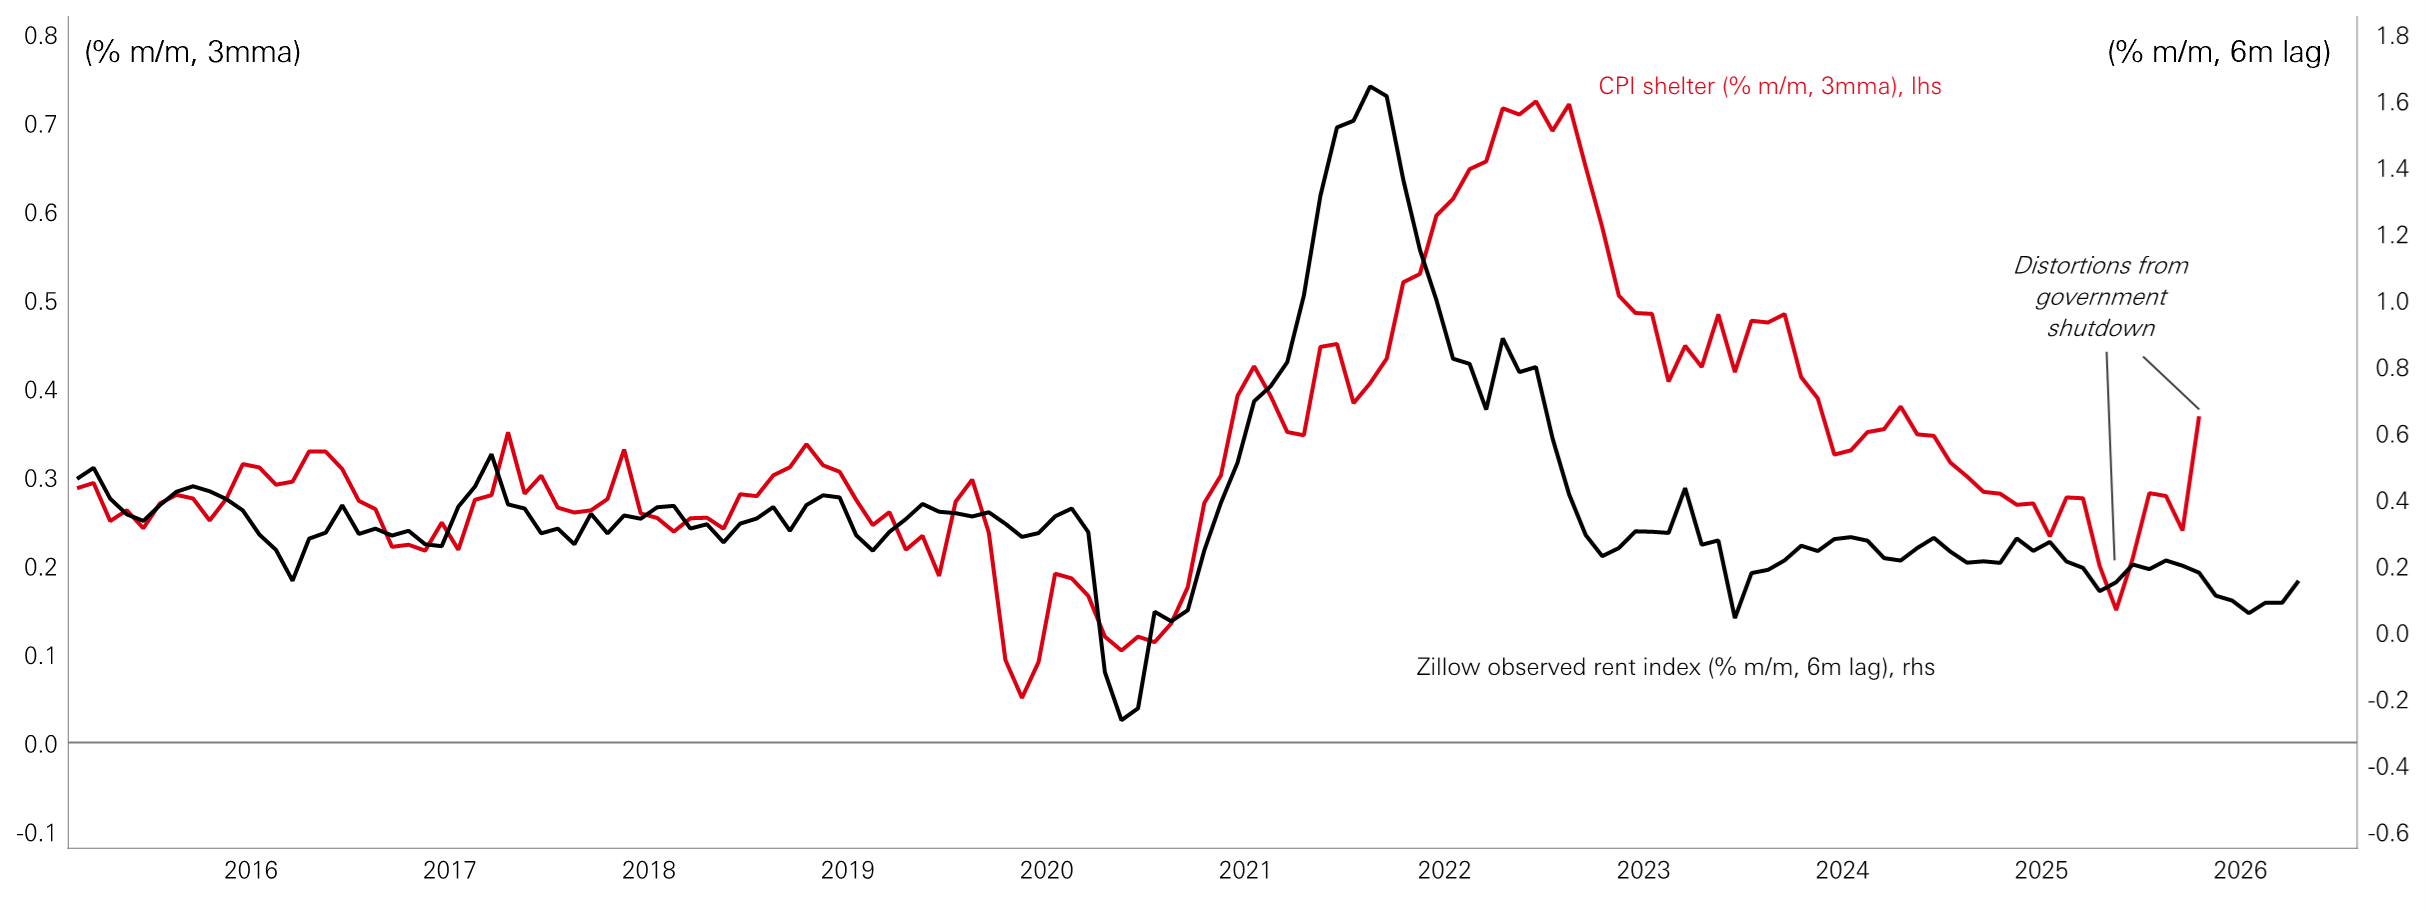
Housing is central because shelter accounts for around 40 per cent of core CPI and roughly a quarter of core PCE. Market‑based rent measures such as the Zillow Observed Rent Index typically lead the official shelter components, although post‑pandemic lags have been unusually long both on the way up and on the way down. Recent data show observed rents slowing further, which points to additional downside for measured shelter inflation as official indices catch up. At the same time, 30‑year mortgage rates remain above 6 per cent, restraining housing activity and house price appreciation and limiting the scope for renewed upward pressure on rents.
Figure 2: New rents remain subdued
Click the image to enlarge
Source: Macrobond, HSBC AM, May 2026.
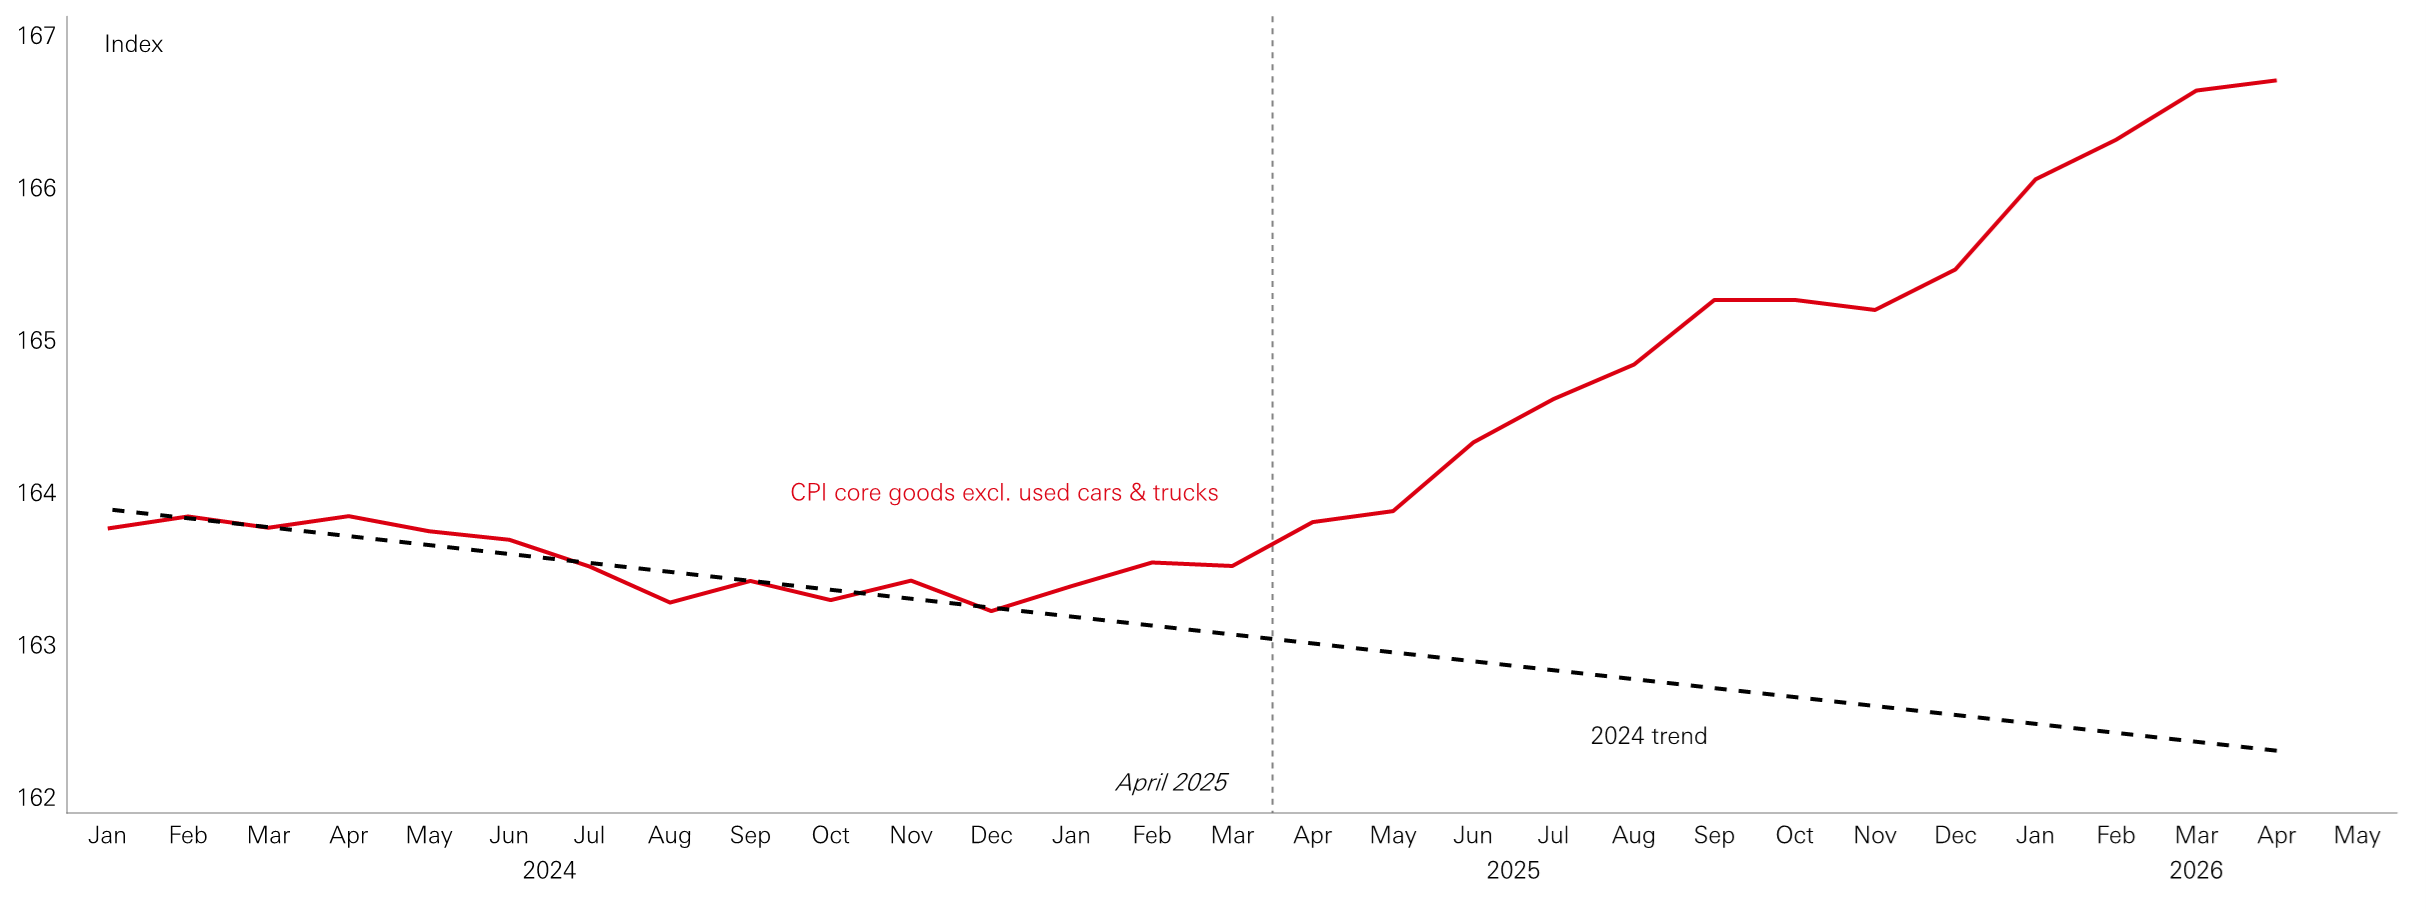
Meanwhile, a year on from ‘Liberation Day’, the core goods CPI excluding cars and trucks is running about 3.0 per cent above its 2024 trend, suggesting that tariff‑induced price increases have made a significant contribution to the stickiness of US inflation. The April CPI, however, showed a relatively muted increase in goods prices. Combined with evidence showing revenues from the tariffs are now falling, we may now be at the point that this source of inflationary pressure is beginning to fade.
Figure 3: Upward core goods CPI from tariffs
Click the image to enlarge
Source: Macrobond, HSBC AM, May 2026.
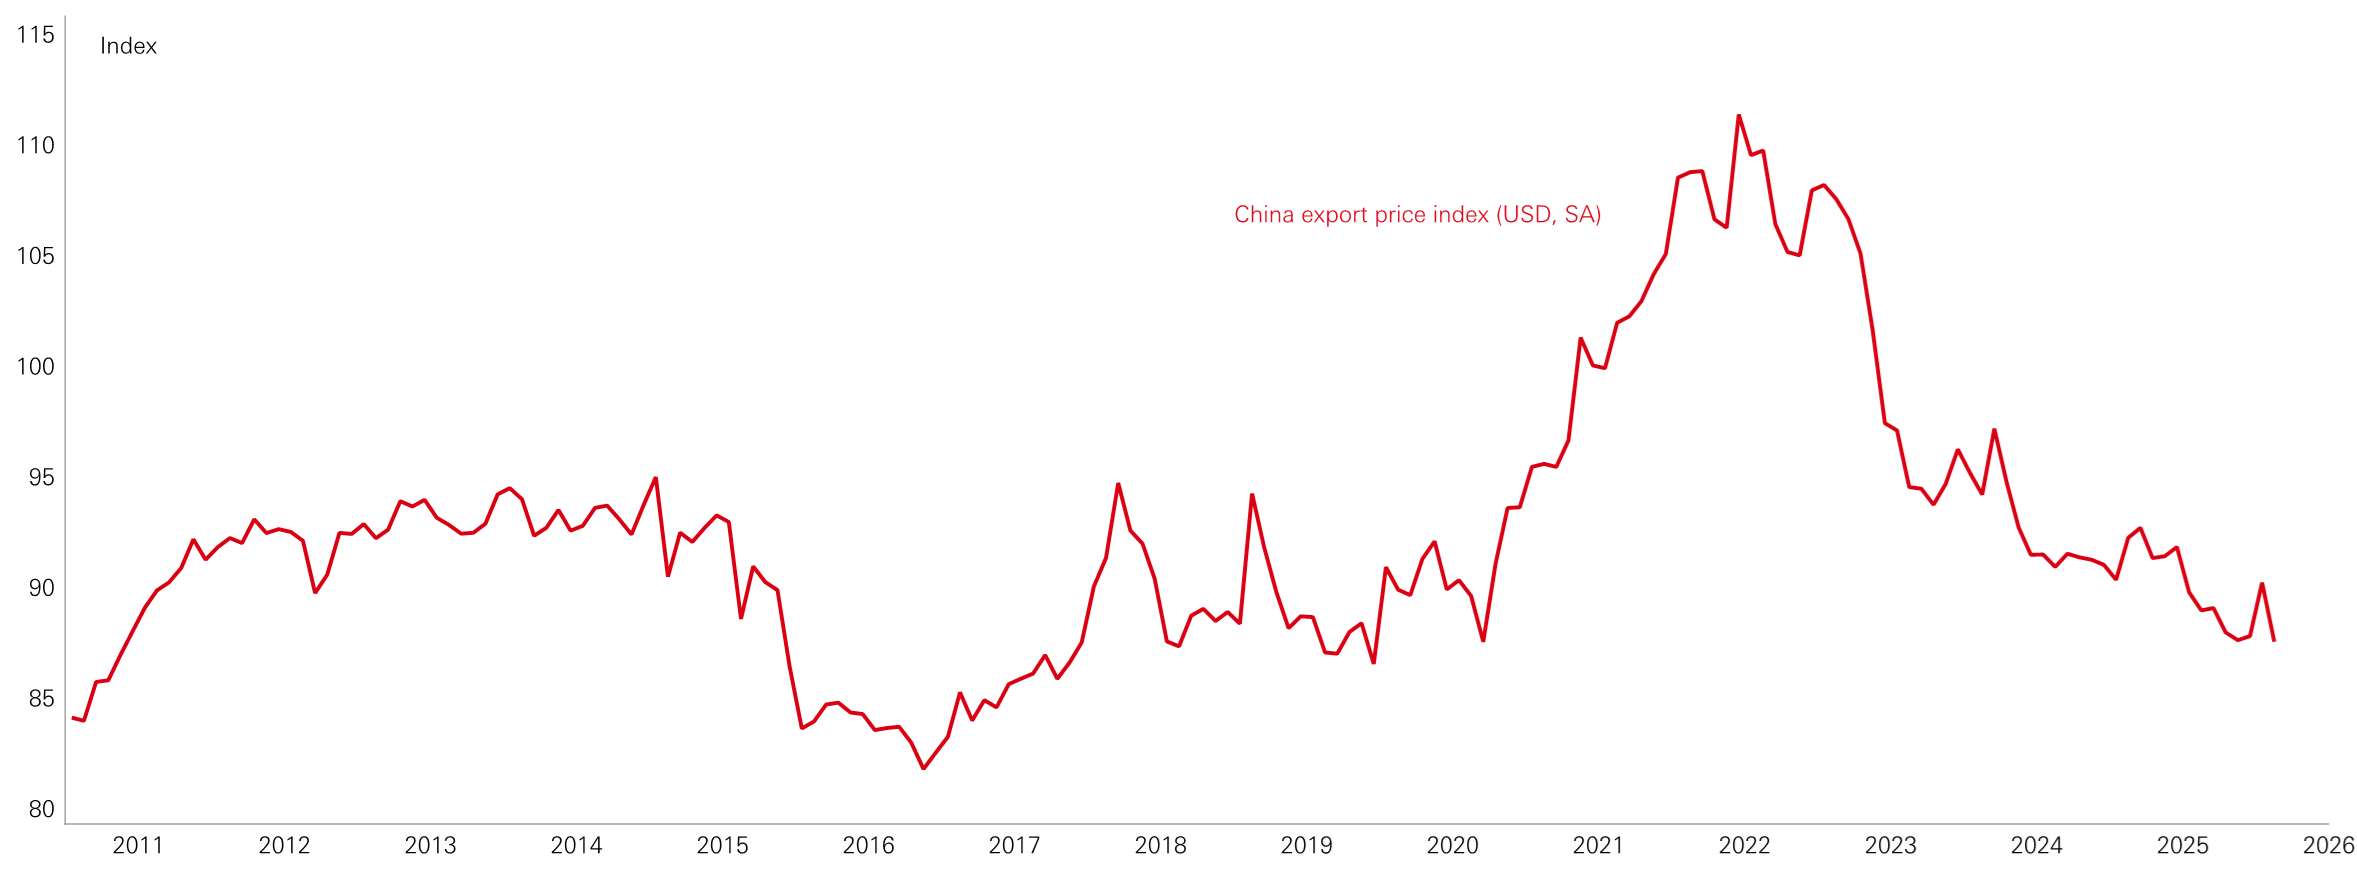
Absent the tariffs, US core goods price inflation would likely have been much more subdued, something highlighted by the declining trend in China’s export prices. China’s role as the world’s largest manufacturer and marginal price setter means it is difficult to generate sustained US goods price inflation in this environment.
The main risk to this pattern of deflationary Chinese export prices is a sustained rise in global energy costs, especially oil, given the historically tight relationship between oil prices and Chinese producer price inflation. The evolution of the Middle East conflict therefore matters not only for direct energy pass‑through into headline inflation but also for the trajectory of global goods prices via Chinese producer and export prices.
Figure 4: China exporting deflation
Click the image to enlarge
Source: Macrobond, HSBC AM, May 2026.
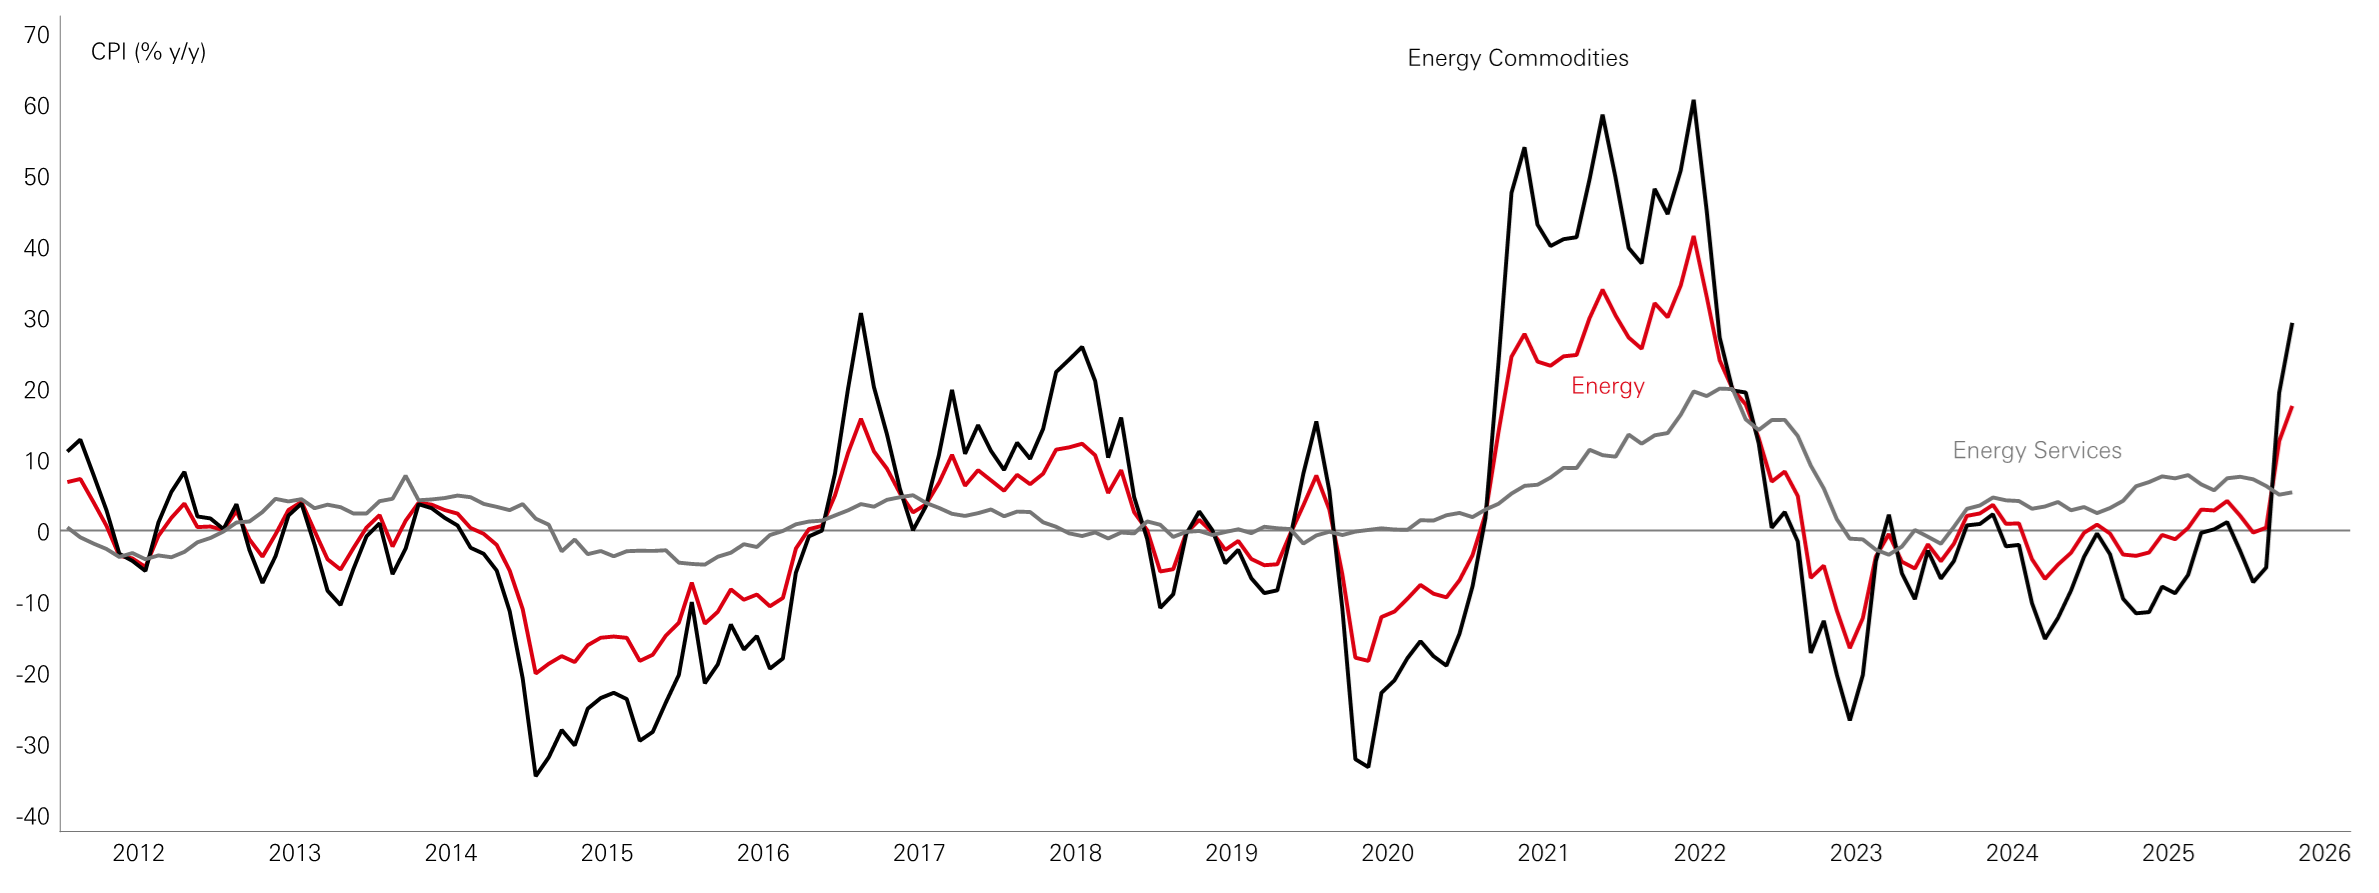
US energy services inflation, dominated by electricity, has been running somewhat above its pre‑pandemic average but well below earlier peaks. Aggregate energy inflation, however, has not been a sustained driver of higher inflation because, until recently, falling energy commodity prices, particularly oil, have offset the modest strength in services.
Figure 5: Energy prices in perspective
Click the image to enlarge
Source: Macrobond, HSBC AM, May 2026.
The current inflationary narrative around electricity prices is shaped by localised pressures rather than a broad national surge, with states such as Maryland, Pennsylvania and Virginia seeing particularly strong increases in areas with heavy data‑centre construction. For households in those regions, electricity bills are rising faster than the national average, but at the aggregate level electricity prices are not yet exerting outsized upward pressure on overall inflation.
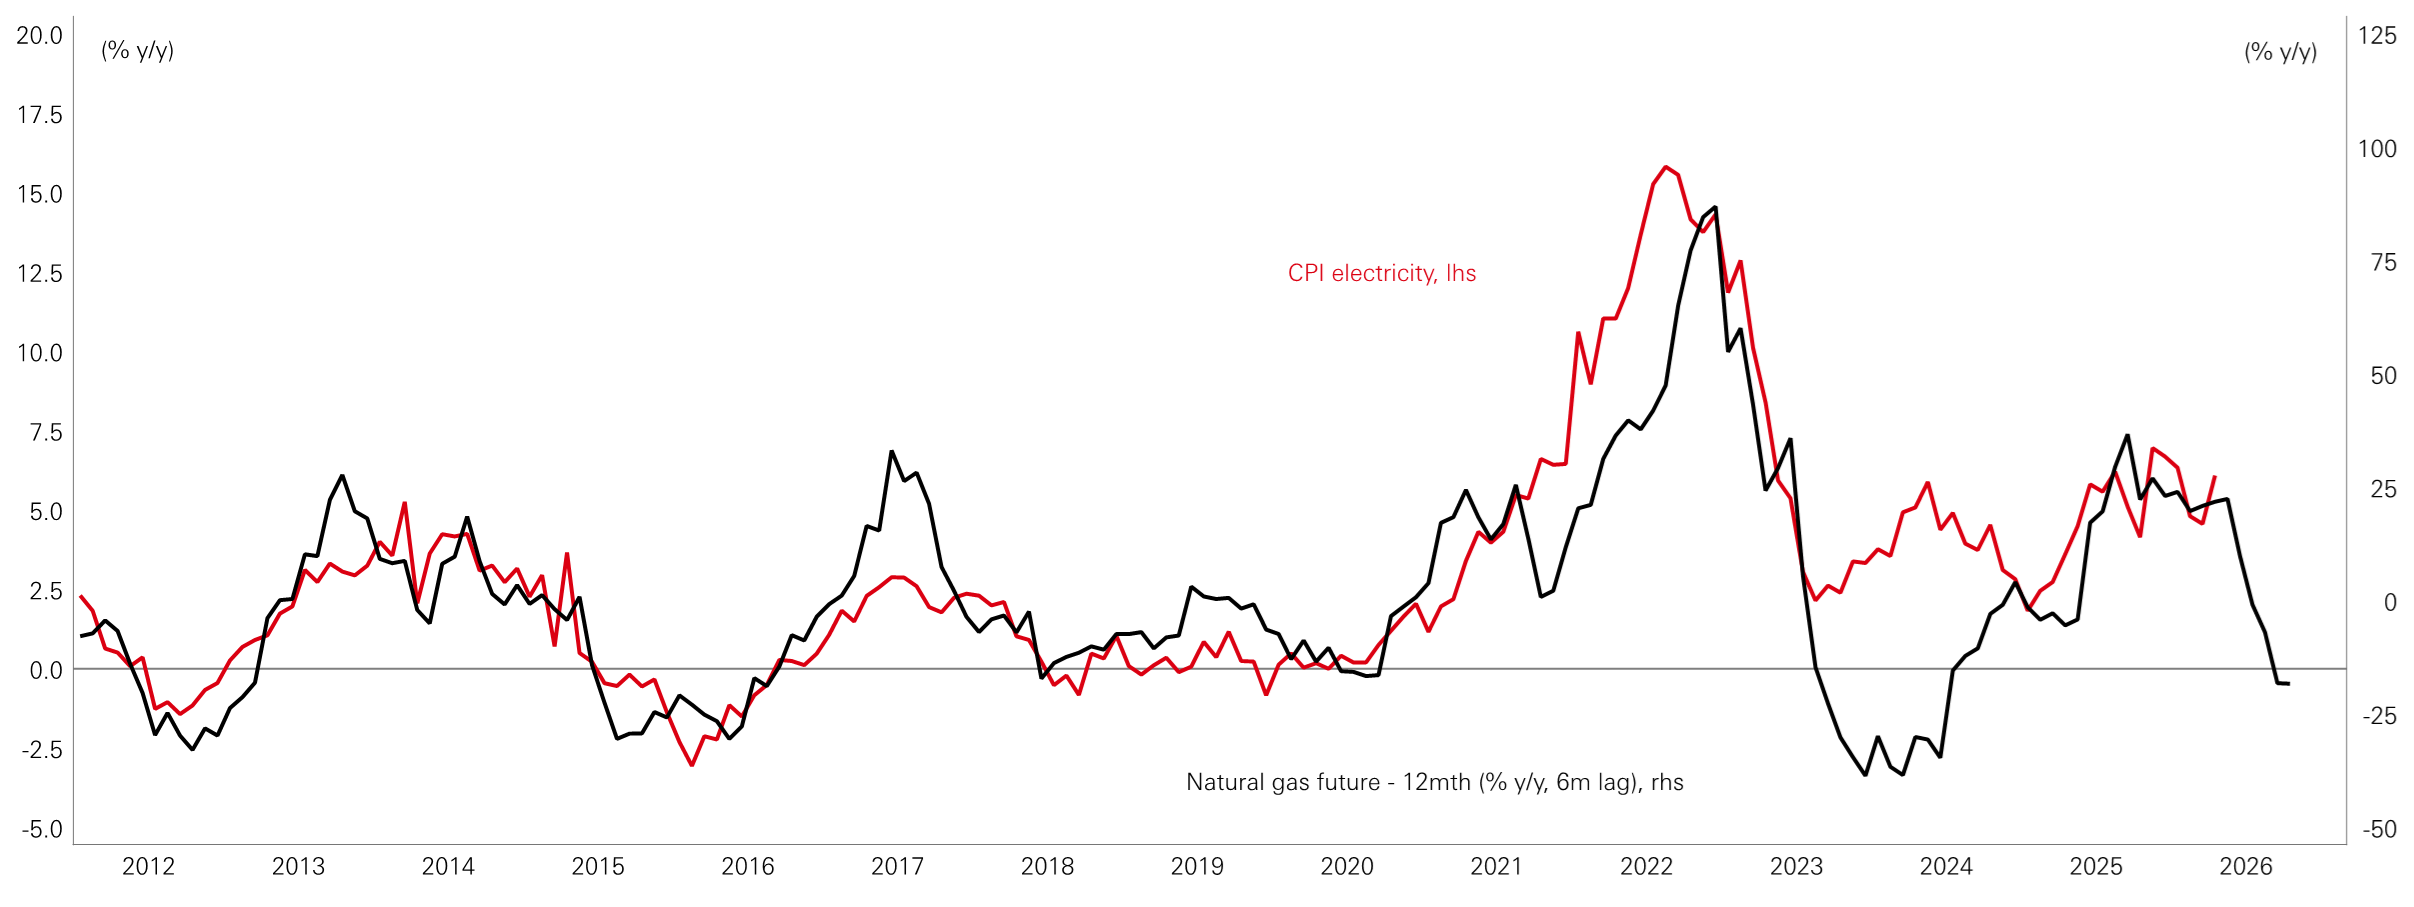
Figure 6: Relationship between gas and electricity prices less reliable than it was
Click the image to enlarge
Source: Macrobond, HSBC AM, May 2026.
In fact, US natural gas prices have correlated closely with CPI electricity prices, and current gas futures suggest some near‑term moderation in electricity inflation. That said, the relationship has weakened in recent years with electricity prices running stronger than gas prices alone implied during 2023 and 2024. From the perspective of the next twelve months, energy services are therefore not expected to be a major independent source of inflation pressure nationally.
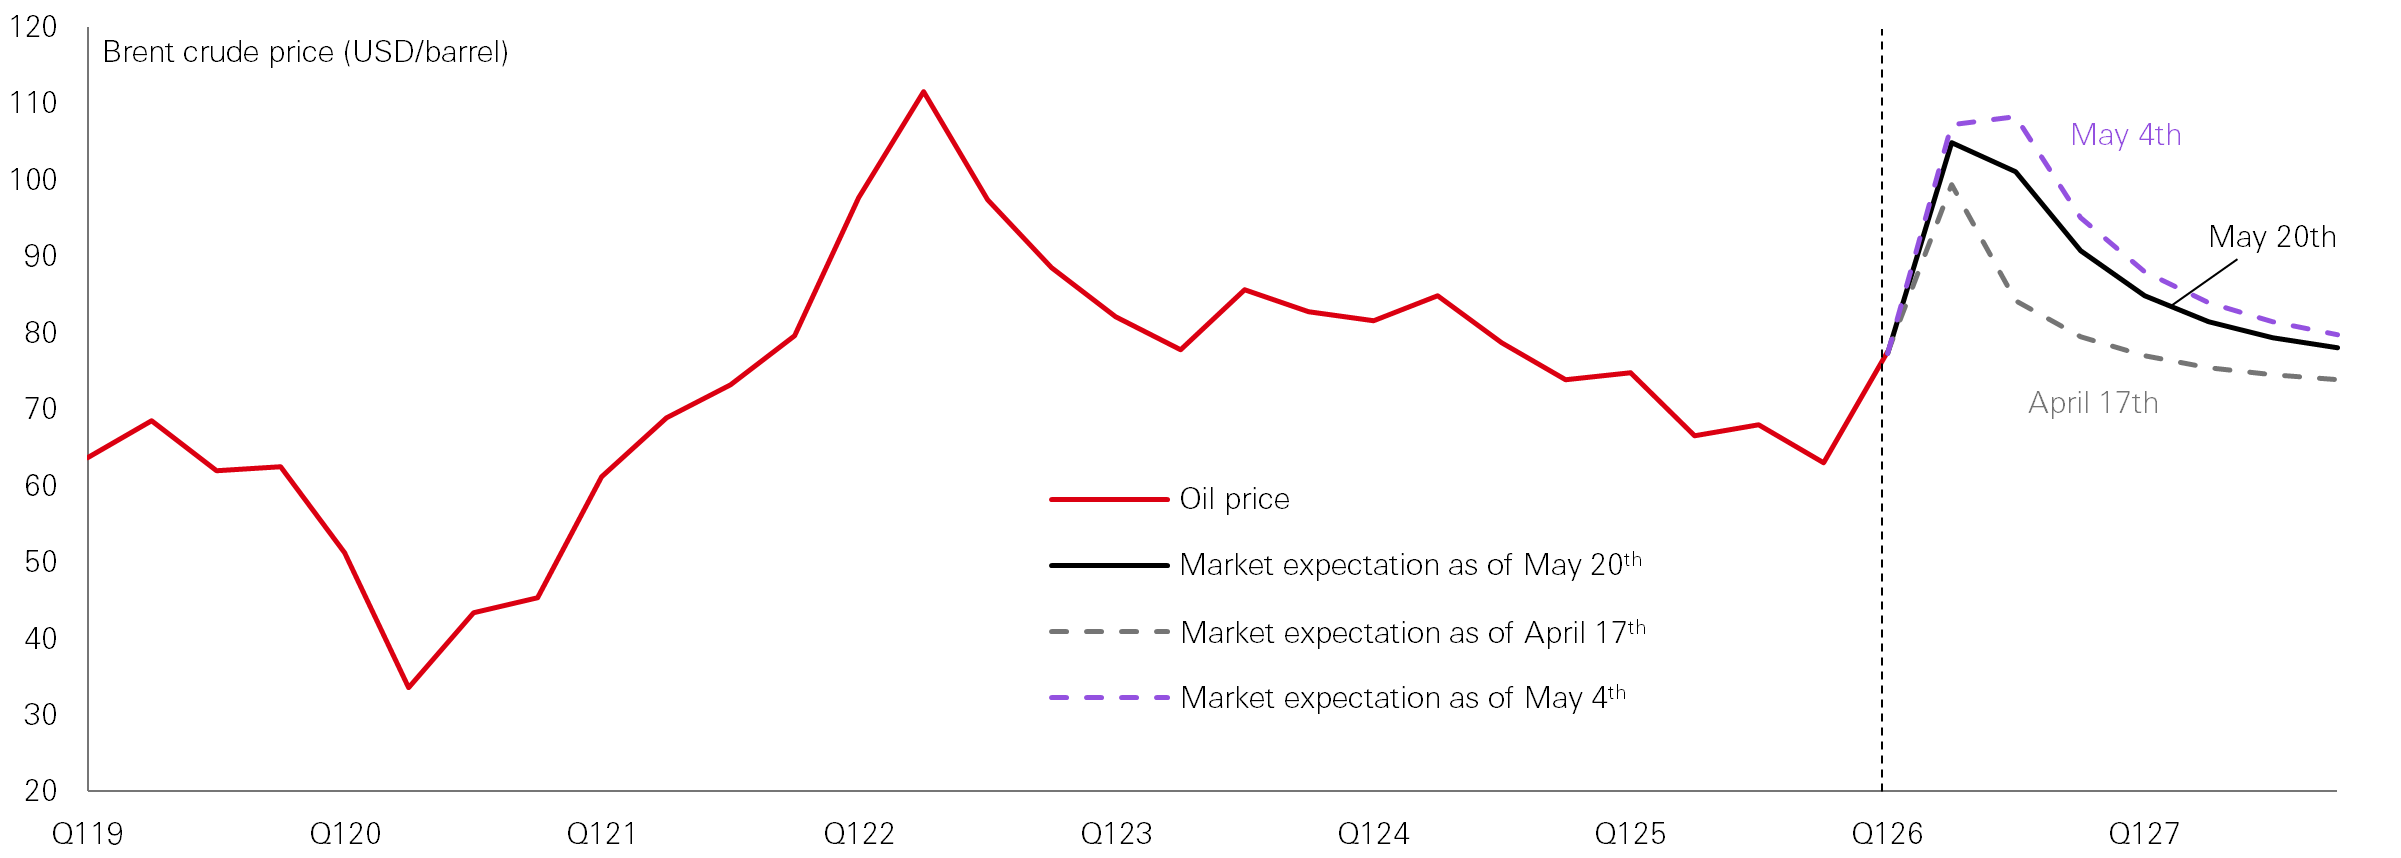
Recent events have shifted attention to oil as a key source of uncertainty for the inflation outlook. Although the brent spot price has been above UD 100/barrel for a sustained period and the futures curve has traded within a wide range, the market is still broadly expecting the price to decline through the remainder of the year and into 2027.
Figure 7: Market pricing a decline in the oil price
Click the image to enlarge
Source: Macrobond, HSBC AM, May 2026.
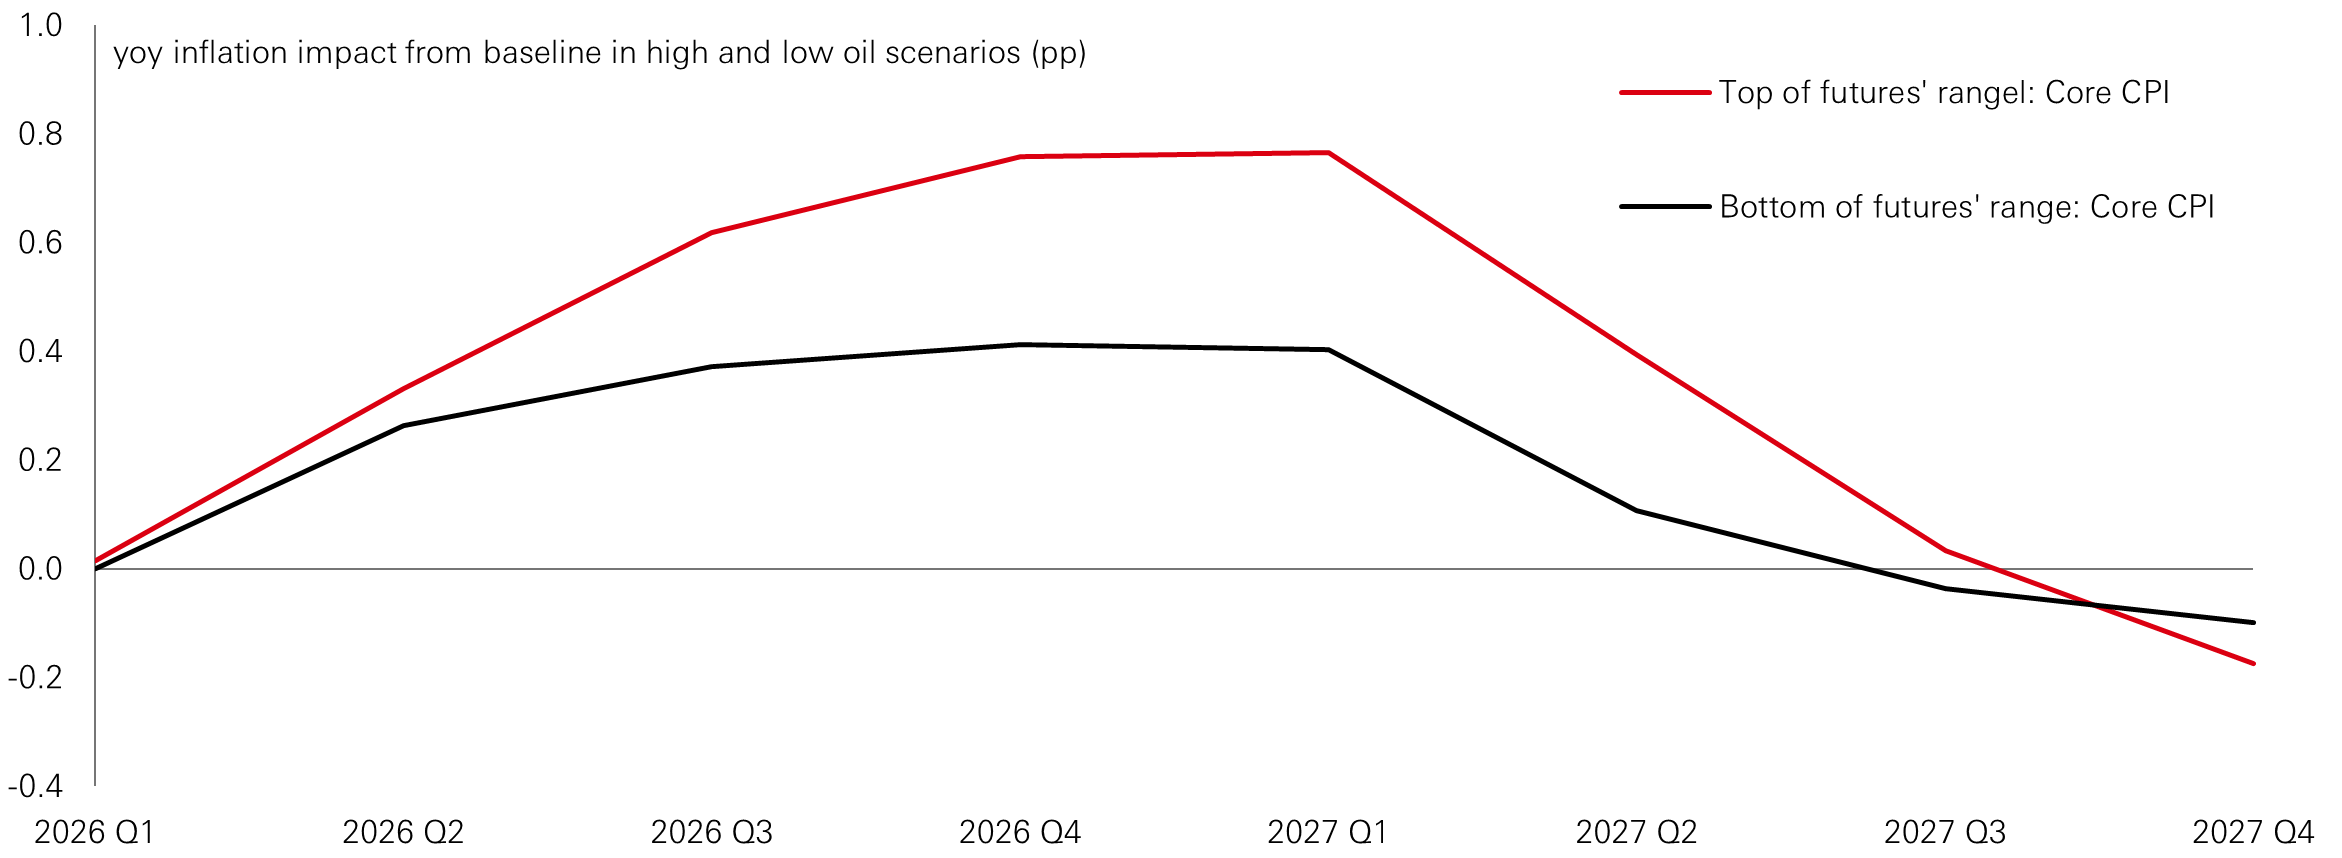
Oxford Economics’ large-scale macroeconomic model suggests that if the brent oil price were to move back towards the low end the range implied by the futures curve in recent weeks, core inflation would be around 0.3–0.4 percentage points higher over the next year than it would have been without this shock. If the oil price instead tracks the upper end of the futures range, the increase could be 0.6–0.8 percentage points. Even in this higher oil price scenario, the effect is temporary: inflation is not expected to stay elevated into 2027, with the impact fading to zero by mid-2027.
Figure 8: Model simulations – would high oil price result in demand shock?
Click the image to enlarge
Source: Oxford Economics, Macrobond, HSBC AM, May 2026.
In conclusion, with a baseline that assumes the oil price declines broadly in line with the futures curve, combined with our analysis of labour, housing and goods, we expect US core CPI to remain relatively sticky through the remainder of the year. We see the year-on-year rate hovering in the 2.5-3.0 per cent range before easing gradually in 2027, as tariff effects fully feed through, second round impacts from energy prices fade, and shelter inflation continues to cool.
In this context, 2 per cent may act more like a floor for core inflation than the midpoint of a target range. Outcomes meaningfully below 2 per cent would likely require a recession. As a result, the Federal Reserve is likely to keep policy on hold through 2026, with modest rate cuts becoming more plausible in early 2027.
Source: HSBC Asset Management, May 2026. The views expressed above were held at the time of preparation and are subject to change without notice. Any forecast, projection or target where provided is indicative only and not guaranteed in any way. HSBC Asset Management accepts no liability for any failure to meet such forecast, projection or target.
For Professional Clients and intermediaries within countries and territories set out below; and for Institutional Investors and Financial Advisors in the US. This document should not be distributed to or relied upon by Retail clients/investors.
The value of investments and the income from them can go down as well as up and investors may not get back the amount originally invested. The performance figures contained in this document relate to past performance, which should not be seen as an indication of future returns. Future returns will depend, inter alia, on market conditions, investment manager’s skill, risk level and fees. Where overseas investments are held the rate of currency exchange may cause the value of such investments to go down as well as up. Investments in emerging markets are by their nature higher risk and potentially more volatile than those inherent in some established markets. Economies in emerging markets generally are heavily dependent upon international trade and, accordingly, have been and may continue to be affected adversely by trade barriers, exchange controls, managed adjustments in relative currency values and other protectionist measures imposed or negotiated by the countries and territories with which they trade. These economies also have been and may continue to be affected adversely by economic conditions in the countries and territories in which they trade.
The contents of this document may not be reproduced or further distributed to any person or entity, whether in whole or in part, for any purpose. All non-authorised reproduction or use of this document will be the responsibility of the user and may lead to legal proceedings. The material contained in this document is for general information purposes only and does not constitute advice or a recommendation to buy or sell investments. Some of the statements contained in this document may be considered forward looking statements which provide current expectations or forecasts of future events. Such forward looking statements are not guarantees of future performance or events and involve risks and uncertainties. Actual results may differ materially from those described in such forward-looking statements as a result of various factors. We do not undertake any obligation to update the forward-looking statements contained herein, or to update the reasons why actual results could differ from those projected in the forward-looking statements. This document has no contractual value and is not by any means intended as a solicitation, nor a recommendation for the purchase or sale of any financial instrument in any jurisdiction in which such an offer is not lawful. The views and opinions expressed herein are those of HSBC Asset Management at the time of preparation and are subject to change at any time. These views may not necessarily indicate current portfolios' composition. Individual portfolios managed by HSBC Asset Management primarily reflect individual clients' objectives, risk preferences, time horizon, and market liquidity. Foreign and emerging markets: investments in foreign markets involve risks such as currency rate fluctuations, potential differences in accounting and taxation policies, as well as possible political, economic, and market risks. These risks are heightened for investments in emerging markets which are also subject to greater illiquidity and volatility than developed foreign markets. This commentary is for information purposes only. It is a marketing communication and does not constitute investment advice or a recommendation to any reader of this content to buy or sell investments nor should it be regarded as investment research. It has not been prepared in accordance with legal requirements designed to promote the independence of investment research and is not subject to any prohibition on dealing ahead of its dissemination. This document is not contractually binding nor are we required to provide this to you by any legislative provision.
All data from HSBC Asset Management unless otherwise specified. Any third-party information has been obtained from sources we believe to be reliable, but which we have not independently verified.
HSBC Asset Management is the brand name for the asset management business of HSBC Group, which includes the investment activities that may be provided through our local regulated entities. HSBC Asset Management isa group of companies in many countries and territories throughout the world that are engaged in investment advisory and fund management activities, which are ultimately owned by HSBC Holdings Plc. (HSBC Group).
- In Australia, this document is issued by HSBC Bank Australia Limited ABN 48 006 434 162, AFSL 232595, for HSBC Global Asset Management (Hong Kong) Limited ARBN 132 834 149 and HSBC Global Asset Management (UK) Limited ARBN 633 929 718. This document is for institutional investors only and is not available for distribution to retail clients (as defined under the Corporations Act). HSBC Global Asset Management (Hong Kong) Limited and HSBC Global Asset Management (UK) Limited are exempt from the requirement to hold an Australian financial services license under the Corporations Act in respect of the financial services they provide. HSBC Global Asset Management (Hong Kong) Limited is regulated by the Securities and Futures Commission of Hong Kong under the Hong Kong laws, which differ from Australian laws. HSBC Global Asset Management (UK) Limited is regulated by the Financial Conduct Authority of the United Kingdom and, for the avoidance of doubt, includes the Financial Services Authority of the United Kingdom as it was previously known before 1 April 2013, under the laws of the United Kingdom, which differ from Australian laws;
- In Bermuda, this document is issued by HSBC Global Asset Management (Bermuda) Limited, of 37 Front Street, Hamilton, Bermuda which is licensed to conduct investment business by the Bermuda Monetary Authority;
- In France, Belgium, Netherlands, Luxembourg, Portugal, Greece, Finland, Norway, Denmark, Spain and Sweden this document is issued by HSBC Global Asset Management (France), a Portfolio Management Company authorised by the French regulatory authority AMF (no. GP99026);
- In Germany, this document is issued by HSBC Global Asset Management (Deutschland) GmbH which is regulated by BaFin (German clients) respective by the Austrian Financial Market Supervision FMA (Austrian clients);
- In Hong Kong, this document is issued by HSBC Global Asset Management (Hong Kong) Limited, which is regulated by the Securities and Futures Commission. This content has not been reviewed by the Securities and Futures Commission;
- In India, this document is issued by HSBC Asset Management (India) Pvt Ltd. which is regulated by the Securities and Exchange Board of India;
- In Italy, this document is issued by HSBC Global Asset Management (France), a Portfolio Management Company authorised by the French regulatory authority AMF (no. GP99026), through its Italian branch, regulated by Banca d’Italia and Commissione Nazionale per le Società e la Borsa (Consob);
- In Japan, this document is issued by HSBC Asset Management (Japan) Ltd (JRN 3010001124868), regulated by the Financial Services Agency;
- In Malta, this document is issued by HSBC Global Asset Management (Malta) Limited which is regulated and licensed to conduct Investment Services by the Malta Financial Services Authority under the Investment Services Act;
- In Mexico, this document is issued by HSBC Global Asset Management (Mexico), SA de CV, Sociedad Operadora de Fondos de Inversión, Grupo Financiero HSBC which is regulated by Comisión Nacional Bancaria y de Valores;
- In the United Arab Emirates, this document is issued by HSBC Investment Funds (Luxembourg) S.A. – Dubai Branch (Level 20, HSBC Tower, PO Box 66, Downtown Dubai, United Arab Emirates) regulated by the Capital Market Authority (CMA) in the UAE to conduct investment fund management, portfolios management, fund administration activities (CMA Category 2 license No.20200000336) and promotion activities (CMA Category 5 license No.20200000327).
- In the United Arab Emirates, this document is issued by HSBC Global Asset Management MENA, a unit within HSBC Bank Middle East Limited, U.A.E Branch, PO Box 66 Dubai, UAE, regulated by the Central Bank of the U.A.E. and the Capital Market Authority in the UAE under CMA license number 602004 for the purpose of this promotion and lead regulated by the Dubai Financial Services Authority. HSBC Bank Middle East Limited is a member of the HSBC Group and HSBC Global Asset Management MENA are marketing the relevant product only in a sub-distributing capacity on a principal-to-principal basis. HSBC Global Asset Management MENA may not be licensed under the laws of the recipient’s country of residence and therefore may not be subject to supervision of the local regulator in the recipient’s country of residence. One of more of the products and services of the manufacturer may not have been approved by or registered with the local regulator and the assets may be booked outside of the recipient’s country of residence.
- In Singapore, this document is issued by HSBC Global Asset Management (Singapore) Limited, which is regulated by the Monetary Authority of Singapore. The content in the document/video has not been reviewed by the Monetary Authority of Singapore;
- In Switzerland, this document is issued by HSBC Global Asset Management (Switzerland) AG. This document is intended for professional investor use only. For opting in and opting out according to FinSA, please refer to our website; if you wish to change your client categorization, please inform us. HSBC Global Asset Management (Switzerland) AG having its registered office at Gartenstrasse 26, PO Box, CH-8002 Zurich has a licence as an asset manager of collective investment schemes and as a representative of foreign collective investment schemes. Disputes regarding legal claims between the Client and HSBC Global Asset Management (Switzerland) AG can be settled by an ombudsman in mediation proceedings. HSBC Global Asset Management (Switzerland) AG is affiliated to the ombudsman FINOS having its registered address at Talstrasse 20, 8001 Zurich. There are general risks associated with financial instruments, please refer to the Swiss Banking Association (“SBA”) Brochure “Risks Involved in Trading in Financial Instruments”;
- In Taiwan, this document is issued by HSBC Global Asset Management (Taiwan) Limited which is regulated by the Financial Supervisory Commission R.O.C. (Taiwan);
- In Turkiye, this document is issued by HSBC Asset Management A.S. Turkiye (AMTU) which is regulated by Capital Markets Board of Turkiye. Any information here is not intended to distribute in any jurisdiction where AMTU does not have a right to. Any views here should not be perceived as investment advice, product/service offer and/or promise of income. Information given here might not be suitable for all investors and investors should be giving their own independent decisions. The investment information, comments and advice given herein are not part of investment advice activity. Investment advice services are provided by authorized institutions to persons and entities privately by considering their risk and return preferences, whereas the comments and advice included herein are of a general nature. Therefore, they may not fit your financial situation and risk and return preferences. For this reason, making an investment decision only by relying on the information given herein may not give rise to results that fit your expectations.
- In the UK, this document is issued by HSBC Global Asset Management (UK) Limited, which is authorised and regulated by the Financial Conduct Authority;
- In the US, this document is issued by HSBC Securities (USA) Inc., an HSBC broker dealer registered in the US with the Securities and Exchange Commission under the Securities Exchange Act of 1934. HSBC Securities (USA) Inc. is also a member of NYSE/FINRA/SIPC. HSBC Securities (USA) Inc. is not authorized by or registered with any other non-US regulatory authority. The contents of this document are confidential and may not be reproduced or further distributed to any person or entity, whether in whole or in part, for any purpose without prior written permission.
- In Chile, operations by HSBC's headquarters or other offices of this bank located abroad are not subject to Chilean inspections or regulations and are not covered by warranty of the Chilean state. Obtain information about the state guarantee to deposits at your bank or on www.cmfchile.cl;
- In Colombia, HSBC Bank USA NA has an authorized representative by the Superintendencia Financiera de Colombia (SFC) whereby its activities conform to the General Legal Financial System. SFC has not reviewed the information provided to the investor. This document is for the exclusive use of institutional investors in Colombia and is not for public distribution;
- In Costa Rica, the Fund and any other products or services referenced in this document are not registered with the Superintendencia General de Valores (“SUGEVAL”) and no regulator or government authority has reviewed this document, or the merits of the products and services referenced herein. This document is directed at and intended for institutional investors only.
- In Peru, HSBC Bank USA NA has an authorized representative by the Superintendencia de Banca y Seguros in Perú whereby its activities conform to the General Legal Financial System - Law No. 26702. Funds have not been registered before the Superintendencia del Mercado de Valores (SMV) and are being placed by means of a private offer. SMV has not reviewed the information provided to the investor. This document is for the exclusive use of institutional investors in Perú and is not for public distribution;
- In Uruguay, operations by HSBC's headquarters or other offices of this bank located abroad are not subject to Uruguayan inspections or regulations and are not covered by warranty of the Uruguayan state. Further information may be obtained about the state guarantee to deposits at your bank or on www.bcu.gub.uy
Copyright © HSBC Global Asset Management Limited 2026. All rights reserved. No part of this publication may be reproduced, stored in a retrieval system, or transmitted, on any form or by any means, electronic, mechanical, photocopying, recording, or otherwise, without the prior written permission of HSBC Asset Management.
Content ID: D071834_v1.0; Expiry Date: 31.05.2027